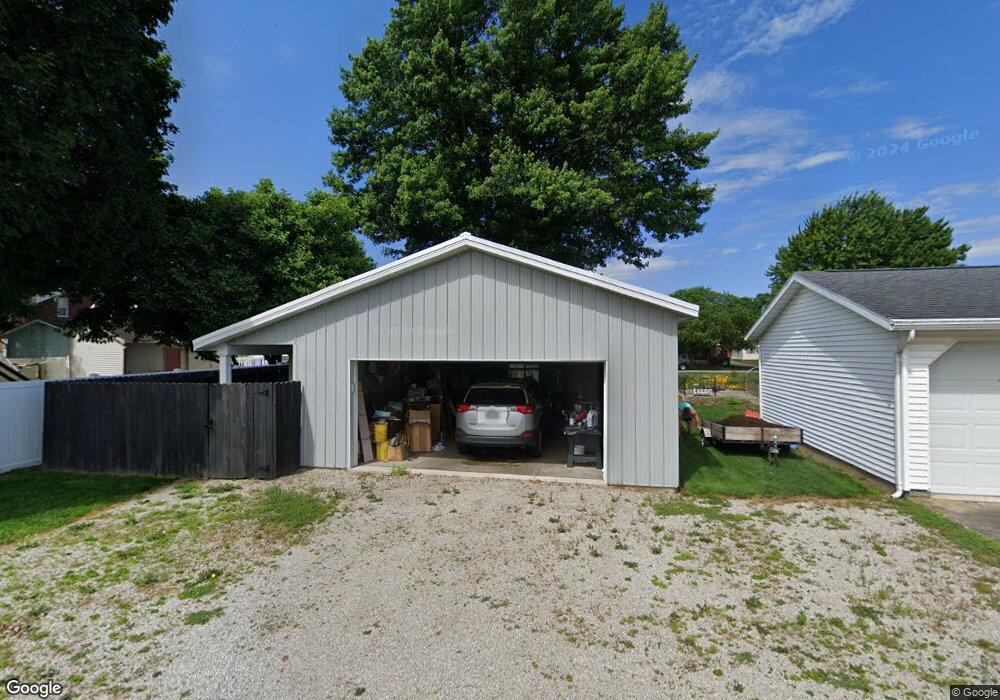
21 Seltzer Ave Shelby, OH 44875
Estimated Value: $129,000 - $150,000
3
Beds
1
Bath
851
Sq Ft
$167/Sq Ft
Est. Value
About This Home
This home is located at 21 Seltzer Ave, Shelby, OH 44875 and is currently estimated at $142,207, approximately $167 per square foot. 21 Seltzer Ave is a home located in Richland County with nearby schools including St. Mary's School.
Ownership History
Date
Name
Owned For
Owner Type
Purchase Details
Closed on
May 17, 1995
Sold by
Mahon Julis P
Bought by
Beer Brenda S
Current Estimated Value
Home Financials for this Owner
Home Financials are based on the most recent Mortgage that was taken out on this home.
Original Mortgage
$49,500
Interest Rate
8.42%
Mortgage Type
New Conventional
Purchase Details
Closed on
Mar 7, 1994
Sold by
Mahon Julis P
Bought by
Mahon Julis P
Purchase Details
Closed on
Jun 1, 1986
Create a Home Valuation Report for This Property
The Home Valuation Report is an in-depth analysis detailing your home's value as well as a comparison with similar homes in the area
Home Values in the Area
Average Home Value in this Area
Purchase History
| Date | Buyer | Sale Price | Title Company |
|---|---|---|---|
| Beer Brenda S | $55,000 | -- | |
| Mahon Julis P | -- | -- | |
| -- | $35,000 | -- |
Source: Public Records
Mortgage History
| Date | Status | Borrower | Loan Amount |
|---|---|---|---|
| Closed | Beer Brenda S | $49,500 |
Source: Public Records
Tax History Compared to Growth
Tax History
| Year | Tax Paid | Tax Assessment Tax Assessment Total Assessment is a certain percentage of the fair market value that is determined by local assessors to be the total taxable value of land and additions on the property. | Land | Improvement |
|---|---|---|---|---|
| 2024 | $1,255 | $32,760 | $8,180 | $24,580 |
| 2023 | $1,255 | $32,760 | $8,180 | $24,580 |
| 2022 | $1,261 | $29,420 | $8,270 | $21,150 |
| 2021 | $1,261 | $29,420 | $8,270 | $21,150 |
| 2020 | $1,262 | $29,420 | $8,270 | $21,150 |
| 2019 | $1,011 | $21,600 | $3,690 | $17,910 |
| 2018 | $1,001 | $21,600 | $3,690 | $17,910 |
| 2017 | $997 | $21,600 | $3,690 | $17,910 |
| 2016 | $1,002 | $21,960 | $3,510 | $18,450 |
| 2015 | $1,002 | $21,960 | $3,510 | $18,450 |
| 2014 | $873 | $20,000 | $3,510 | $16,490 |
| 2012 | $429 | $19,990 | $3,690 | $16,300 |
Source: Public Records
Map
Nearby Homes