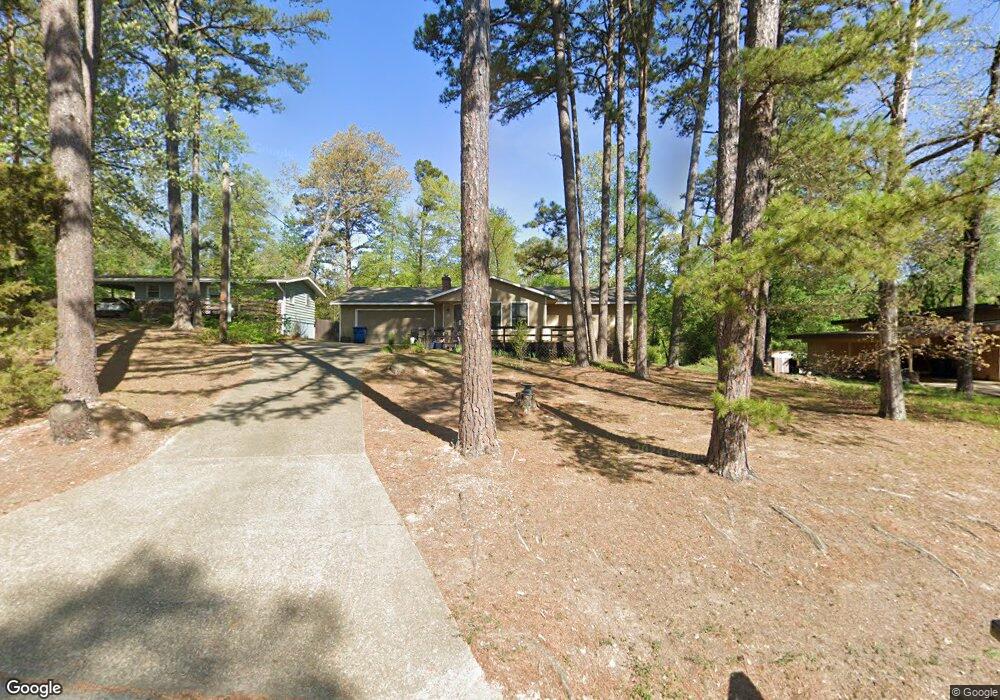
21 Sheneman Dr Bella Vista, AR 72715
Estimated Value: $229,000 - $279,000
2
Beds
2
Baths
1,167
Sq Ft
$218/Sq Ft
Est. Value
About This Home
This home is located at 21 Sheneman Dr, Bella Vista, AR 72715 and is currently estimated at $254,505, approximately $218 per square foot. 21 Sheneman Dr is a home located in Benton County with nearby schools including Cooper Elementary School, Old High Middle School, and Washington Junior High School.
Ownership History
Date
Name
Owned For
Owner Type
Purchase Details
Closed on
Oct 27, 2015
Sold by
Morse Gary Paul and Owen Molly Ann
Bought by
Morse & Owen Llc
Current Estimated Value
Purchase Details
Closed on
May 5, 2011
Sold by
Owen Molly Ann and Morse Family Trust
Bought by
Owen Molly Ann and Morse Gary Paul
Purchase Details
Closed on
Oct 21, 1999
Bought by
Owen
Purchase Details
Closed on
May 20, 1993
Bought by
Stephen
Purchase Details
Closed on
Apr 25, 1991
Bought by
Yarges
Purchase Details
Closed on
Apr 25, 1990
Bought by
Moreman
Purchase Details
Closed on
Jul 8, 1988
Bought by
Daniel
Purchase Details
Closed on
Aug 22, 1980
Bought by
Wood
Create a Home Valuation Report for This Property
The Home Valuation Report is an in-depth analysis detailing your home's value as well as a comparison with similar homes in the area
Home Values in the Area
Average Home Value in this Area
Purchase History
| Date | Buyer | Sale Price | Title Company |
|---|---|---|---|
| Morse & Owen Llc | -- | Attorney | |
| Owen Molly Ann | -- | None Available | |
| Owen | $70,000 | -- | |
| Stephen | $67,000 | -- | |
| Yarges | $54,000 | -- | |
| Moreman | $6,000 | -- | |
| Daniel | $35,000 | -- | |
| Wood | $32,000 | -- |
Source: Public Records
Tax History Compared to Growth
Tax History
| Year | Tax Paid | Tax Assessment Tax Assessment Total Assessment is a certain percentage of the fair market value that is determined by local assessors to be the total taxable value of land and additions on the property. | Land | Improvement |
|---|---|---|---|---|
| 2025 | $972 | $43,574 | $1,600 | $41,974 |
| 2024 | $962 | $43,574 | $1,600 | $41,974 |
| 2023 | $962 | $28,800 | $800 | $28,000 |
| 2022 | $618 | $28,800 | $800 | $28,000 |
| 2021 | $616 | $28,800 | $800 | $28,000 |
| 2020 | $624 | $19,650 | $600 | $19,050 |
| 2019 | $624 | $19,650 | $600 | $19,050 |
| 2018 | $649 | $19,650 | $600 | $19,050 |
| 2017 | $612 | $19,650 | $600 | $19,050 |
| 2016 | $612 | $19,650 | $600 | $19,050 |
| 2015 | $933 | $18,840 | $1,000 | $17,840 |
| 2014 | $583 | $18,840 | $1,000 | $17,840 |
Source: Public Records
Map
Nearby Homes