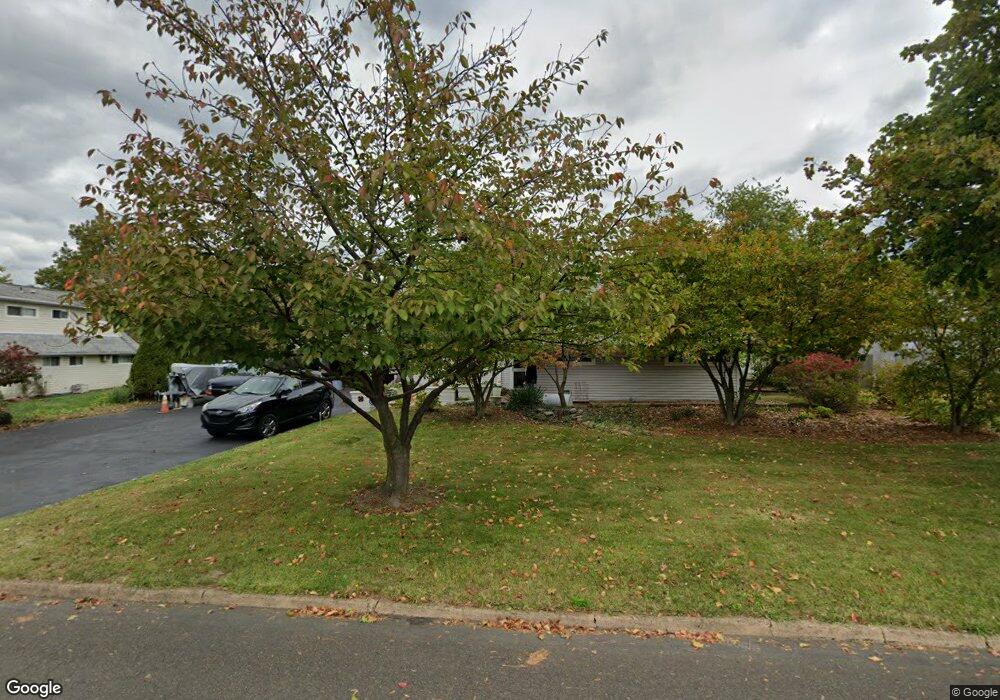
21 Spinythorn Rd Levittown, PA 19056
Snowball Gate NeighborhoodEstimated Value: $507,000 - $540,000
4
Beds
3
Baths
2,298
Sq Ft
$226/Sq Ft
Est. Value
About This Home
This home is located at 21 Spinythorn Rd, Levittown, PA 19056 and is currently estimated at $519,279, approximately $225 per square foot. 21 Spinythorn Rd is a home located in Bucks County with nearby schools including Albert Schweitzer Elementary School, Sandburg Middle School, and Neshaminy High School.
Ownership History
Date
Name
Owned For
Owner Type
Purchase Details
Closed on
Jan 24, 1985
Sold by
Rice Rhoda G
Bought by
Mosley Ricky and Mosley Susan
Current Estimated Value
Create a Home Valuation Report for This Property
The Home Valuation Report is an in-depth analysis detailing your home's value as well as a comparison with similar homes in the area
Home Values in the Area
Average Home Value in this Area
Purchase History
| Date | Buyer | Sale Price | Title Company |
|---|---|---|---|
| Mosley Ricky | -- | -- |
Source: Public Records
Tax History Compared to Growth
Tax History
| Year | Tax Paid | Tax Assessment Tax Assessment Total Assessment is a certain percentage of the fair market value that is determined by local assessors to be the total taxable value of land and additions on the property. | Land | Improvement |
|---|---|---|---|---|
| 2025 | $5,922 | $27,200 | $6,160 | $21,040 |
| 2024 | $5,922 | $27,200 | $6,160 | $21,040 |
| 2023 | $5,828 | $27,200 | $6,160 | $21,040 |
| 2022 | $5,674 | $27,200 | $6,160 | $21,040 |
| 2021 | $5,674 | $27,200 | $6,160 | $21,040 |
| 2020 | $5,606 | $27,200 | $6,160 | $21,040 |
| 2019 | $5,481 | $27,200 | $6,160 | $21,040 |
| 2018 | $5,381 | $27,200 | $6,160 | $21,040 |
| 2017 | $5,243 | $27,200 | $6,160 | $21,040 |
| 2016 | $5,243 | $27,200 | $6,160 | $21,040 |
| 2015 | $5,433 | $27,200 | $6,160 | $21,040 |
| 2014 | $5,433 | $27,200 | $6,160 | $21,040 |
Source: Public Records
Map
Nearby Homes
- 19 Spinythorn Rd
- 25 Spinythorn Rd
- 30 Spicebush Rd
- 24 Spicebush Rd
- 36 Spicebush Rd
- 24 Spinythorn Rd
- 18 Spinythorn Rd
- 18 Spicebush Rd
- 15 Spinythorn Rd
- 31 Spinythorn Rd
- 30 Spinythorn Rd
- 42 Spicebush Rd
- 14 Spinythorn Rd
- 12 Spicebush Rd
- 17 Silverbell Rd
- 27 Spicebush Rd
- 23 Spicebush Rd
- 31 Spicebush Rd
- 9 Spinythorn Rd
- 21 Silverbell Rd