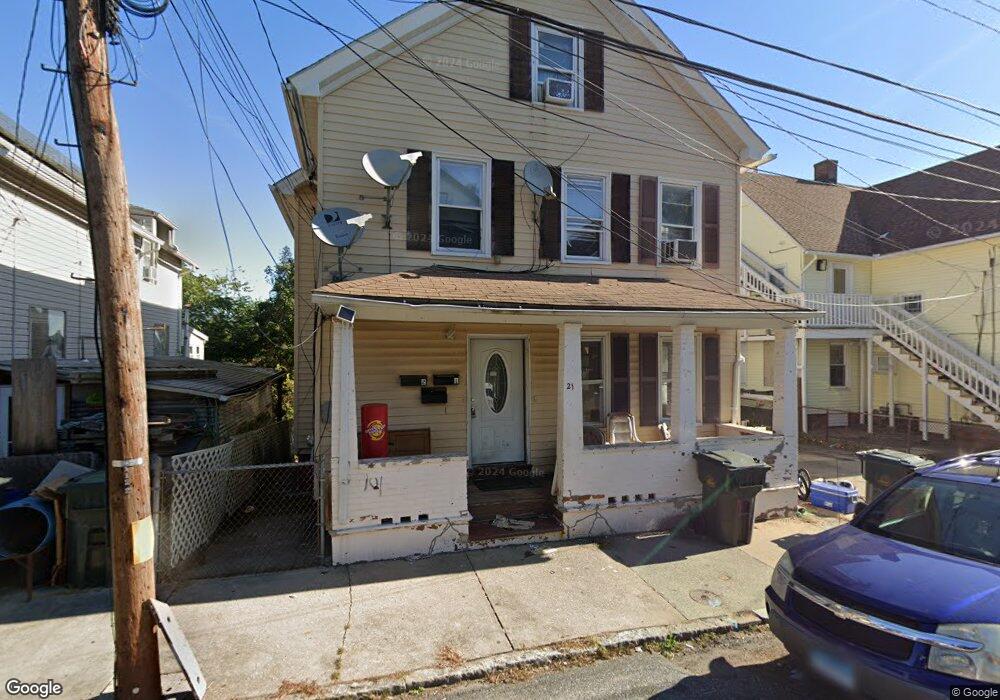
21 Spring St New London, CT 06320
Jefferson NeighborhoodEstimated Value: $224,000 - $303,000
4
Beds
3
Baths
1,470
Sq Ft
$174/Sq Ft
Est. Value
About This Home
This home is located at 21 Spring St, New London, CT 06320 and is currently estimated at $255,101, approximately $173 per square foot. 21 Spring St is a home located in New London County with nearby schools including Harbor Elementary School, Bennie Dover Jackson Middle School, and New London High School.
Ownership History
Date
Name
Owned For
Owner Type
Purchase Details
Closed on
Mar 18, 2005
Sold by
Ramos Vetillio
Bought by
Ampuero Jose and Guinassi Tatiana
Current Estimated Value
Purchase Details
Closed on
May 4, 2004
Sold by
Penman Shannon
Bought by
Ramos Vetilio
Purchase Details
Closed on
Mar 17, 2000
Sold by
Carter Morris E
Bought by
Penman Shannon R
Purchase Details
Closed on
Jun 15, 1992
Sold by
Bankers Tr Co
Bought by
Rivera Candido and Rivera Edith
Create a Home Valuation Report for This Property
The Home Valuation Report is an in-depth analysis detailing your home's value as well as a comparison with similar homes in the area
Home Values in the Area
Average Home Value in this Area
Purchase History
| Date | Buyer | Sale Price | Title Company |
|---|---|---|---|
| Ampuero Jose | $232,000 | -- | |
| Ampuero Jose | $232,000 | -- | |
| Ramos Vetilio | $172,000 | -- | |
| Ramos Vetilio | $172,000 | -- | |
| Penman Shannon R | $30,000 | -- | |
| Penman Shannon R | $30,000 | -- | |
| Rivera Candido | $61,000 | -- | |
| Rivera Candido | $61,000 | -- |
Source: Public Records
Mortgage History
| Date | Status | Borrower | Loan Amount |
|---|---|---|---|
| Open | Rivera Candido | $248,675 | |
| Closed | Rivera Candido | $248,675 |
Source: Public Records
Tax History Compared to Growth
Tax History
| Year | Tax Paid | Tax Assessment Tax Assessment Total Assessment is a certain percentage of the fair market value that is determined by local assessors to be the total taxable value of land and additions on the property. | Land | Improvement |
|---|---|---|---|---|
| 2025 | $3,599 | $132,300 | $40,300 | $92,000 |
| 2024 | $3,638 | $132,300 | $40,300 | $92,000 |
| 2023 | $3,366 | $90,400 | $32,160 | $58,240 |
| 2022 | $3,373 | $90,400 | $32,160 | $58,240 |
| 2021 | $3,431 | $90,400 | $32,160 | $58,240 |
| 2020 | $3,451 | $90,370 | $32,130 | $58,240 |
| 2019 | $3,606 | $90,370 | $32,130 | $58,240 |
| 2018 | $3,414 | $78,050 | $30,940 | $47,110 |
| 2017 | $3,454 | $78,050 | $30,940 | $47,110 |
| 2016 | $3,158 | $78,050 | $30,940 | $47,110 |
| 2015 | $3,082 | $78,050 | $30,940 | $47,110 |
| 2014 | $2,675 | $78,050 | $30,940 | $47,110 |
Source: Public Records
Map
Nearby Homes
- 26 Jefferson Ave
- 835 Bank St
- 49 Belden St
- 77 Colman St
- 55 Connecticut Ave
- 59 Connecticut Ave
- 32 Moore Ave
- 38 Mountain Ave
- 142 Montauk Ave
- 2 Faye St
- 18 W Pleasant St
- 2 Coit St Unit 1
- 152 Blydenburg Ave
- 9 Brewer St Unit 3
- 9 Brewer St Unit 1
- 9 Brewer St Unit 2
- 9 Brewer St
- 400 Bank St Unit 105
- 72 Willetts Ave
- 35 Pine St