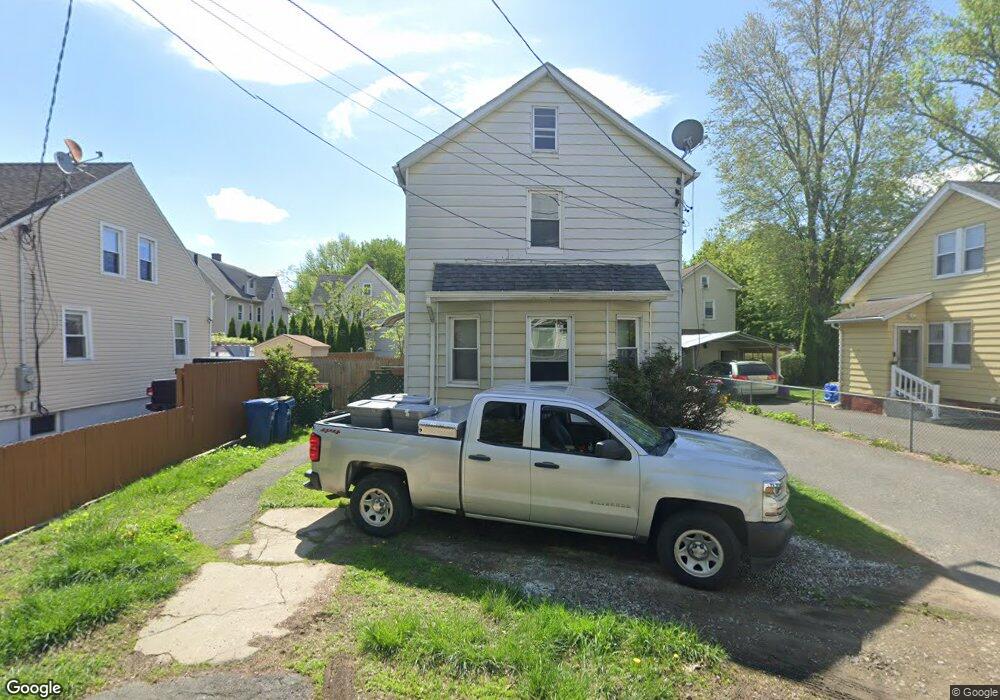
21 Spring St West Springfield, MA 01089
Estimated Value: $281,582 - $344,000
4
Beds
1
Bath
1,407
Sq Ft
$219/Sq Ft
Est. Value
About This Home
This home is located at 21 Spring St, West Springfield, MA 01089 and is currently estimated at $308,646, approximately $219 per square foot. 21 Spring St is a home located in Hampden County with nearby schools including West Springfield High School and Hampden Charter School of Science West.
Ownership History
Date
Name
Owned For
Owner Type
Purchase Details
Closed on
Mar 19, 2014
Sold by
Gagne Shirley
Bought by
Gagne Shirley and Ennis Anthony M
Current Estimated Value
Purchase Details
Closed on
Aug 29, 2013
Sold by
Klinger Doreen and Gagne Shirley
Bought by
Gagne Shirley
Create a Home Valuation Report for This Property
The Home Valuation Report is an in-depth analysis detailing your home's value as well as a comparison with similar homes in the area
Home Values in the Area
Average Home Value in this Area
Purchase History
| Date | Buyer | Sale Price | Title Company |
|---|---|---|---|
| Gagne Shirley | -- | -- | |
| Gagne Shirley | -- | -- |
Source: Public Records
Tax History
| Year | Tax Paid | Tax Assessment Tax Assessment Total Assessment is a certain percentage of the fair market value that is determined by local assessors to be the total taxable value of land and additions on the property. | Land | Improvement |
|---|---|---|---|---|
| 2025 | $3,304 | $222,200 | $93,700 | $128,500 |
| 2024 | $3,125 | $211,000 | $93,700 | $117,300 |
| 2023 | $2,845 | $183,100 | $84,200 | $98,900 |
| 2022 | $2,586 | $164,100 | $76,400 | $87,700 |
| 2021 | $2,494 | $147,600 | $69,500 | $78,100 |
| 2020 | $2,508 | $147,600 | $69,500 | $78,100 |
| 2019 | $2,503 | $147,600 | $69,500 | $78,100 |
| 2018 | $2,517 | $147,600 | $69,500 | $78,100 |
| 2017 | $2,517 | $147,600 | $69,500 | $78,100 |
| 2016 | $2,462 | $144,900 | $66,800 | $78,100 |
| 2015 | $2,328 | $137,000 | $65,500 | $71,500 |
| 2014 | $519 | $137,000 | $65,500 | $71,500 |
Source: Public Records
Map
Nearby Homes
Your Personal Tour Guide
Ask me questions while you tour the home.