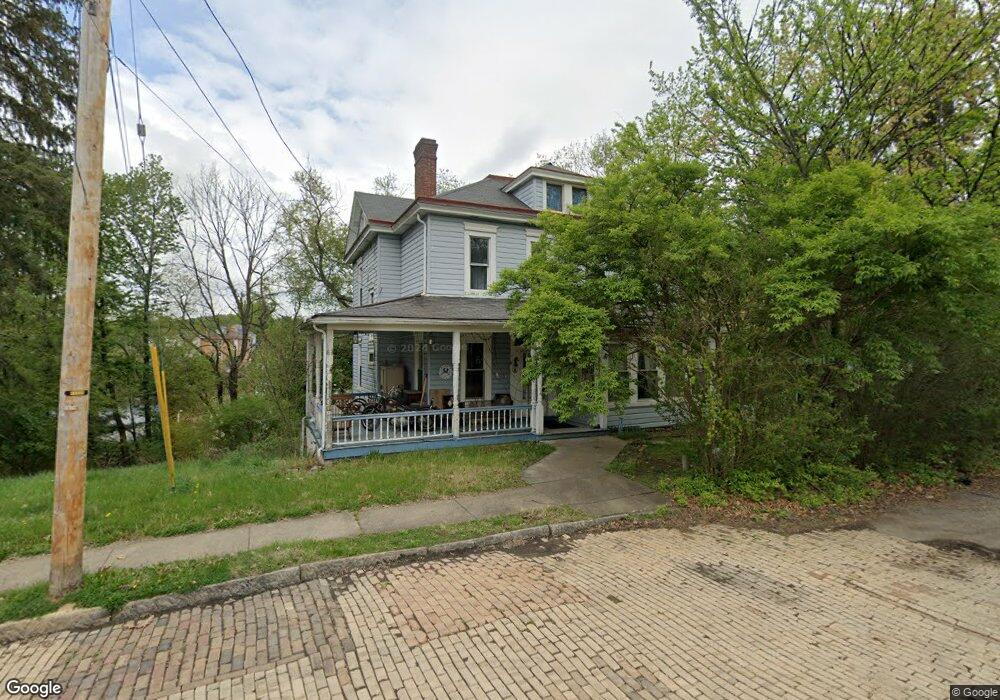
21 Stanwood St Pittsburgh, PA 15205
Estimated Value: $166,000 - $254,000
4
Beds
1
Bath
1,996
Sq Ft
$104/Sq Ft
Est. Value
About This Home
This home is located at 21 Stanwood St, Pittsburgh, PA 15205 and is currently estimated at $208,427, approximately $104 per square foot. 21 Stanwood St is a home located in Allegheny County with nearby schools including Carlynton Junior/Senior High School, St. Philip School, and Al-Andalus School.
Ownership History
Date
Name
Owned For
Owner Type
Purchase Details
Closed on
Sep 26, 2012
Sold by
Neill Jill E O
Bought by
Connolly Michael J
Current Estimated Value
Home Financials for this Owner
Home Financials are based on the most recent Mortgage that was taken out on this home.
Original Mortgage
$81,000
Outstanding Balance
$56,380
Interest Rate
3.62%
Mortgage Type
New Conventional
Estimated Equity
$152,047
Create a Home Valuation Report for This Property
The Home Valuation Report is an in-depth analysis detailing your home's value as well as a comparison with similar homes in the area
Home Values in the Area
Average Home Value in this Area
Purchase History
| Date | Buyer | Sale Price | Title Company |
|---|---|---|---|
| Connolly Michael J | $90,000 | -- |
Source: Public Records
Mortgage History
| Date | Status | Borrower | Loan Amount |
|---|---|---|---|
| Open | Connolly Michael J | $81,000 |
Source: Public Records
Tax History Compared to Growth
Tax History
| Year | Tax Paid | Tax Assessment Tax Assessment Total Assessment is a certain percentage of the fair market value that is determined by local assessors to be the total taxable value of land and additions on the property. | Land | Improvement |
|---|---|---|---|---|
| 2025 | $2,828 | $70,600 | $26,900 | $43,700 |
| 2024 | $2,828 | $70,600 | $26,900 | $43,700 |
| 2023 | $2,828 | $70,600 | $26,900 | $43,700 |
| 2022 | $2,828 | $70,600 | $26,900 | $43,700 |
| 2021 | $334 | $70,600 | $26,900 | $43,700 |
| 2020 | $2,577 | $70,600 | $26,900 | $43,700 |
| 2019 | $2,529 | $70,600 | $26,900 | $43,700 |
| 2018 | $334 | $70,600 | $26,900 | $43,700 |
| 2017 | $2,392 | $70,600 | $26,900 | $43,700 |
| 2016 | $334 | $70,600 | $26,900 | $43,700 |
| 2015 | $334 | $70,600 | $26,900 | $43,700 |
| 2014 | $2,218 | $70,600 | $26,900 | $43,700 |
Source: Public Records
Map
Nearby Homes