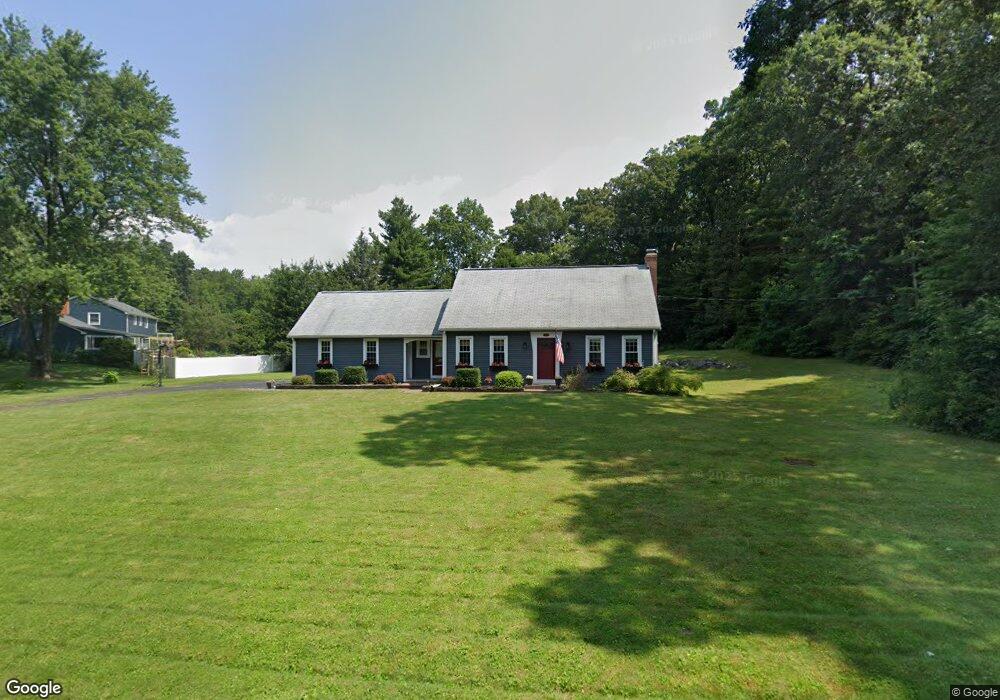
21 Surry Cir Simsbury, CT 06070
Estimated Value: $472,201 - $581,000
3
Beds
2
Baths
1,603
Sq Ft
$325/Sq Ft
Est. Value
About This Home
This home is located at 21 Surry Cir, Simsbury, CT 06070 and is currently estimated at $521,300, approximately $325 per square foot. 21 Surry Cir is a home located in Hartford County with nearby schools including Squadron Line School, Henry James Memorial School, and Simsbury High School.
Ownership History
Date
Name
Owned For
Owner Type
Purchase Details
Closed on
Jan 29, 1999
Sold by
Thompson Edward A
Bought by
Dennehy William M and Dennehy Anne Marie
Current Estimated Value
Purchase Details
Closed on
Aug 31, 1995
Sold by
Berube Kathy and Berube John
Bought by
Gibbs Marilyn
Purchase Details
Closed on
Jul 13, 1990
Sold by
Rooney James
Bought by
Thompson Edward
Create a Home Valuation Report for This Property
The Home Valuation Report is an in-depth analysis detailing your home's value as well as a comparison with similar homes in the area
Home Values in the Area
Average Home Value in this Area
Purchase History
| Date | Buyer | Sale Price | Title Company |
|---|---|---|---|
| Dennehy William M | $189,000 | -- | |
| Gibbs Marilyn | $151,000 | -- | |
| Thompson Edward | $182,000 | -- |
Source: Public Records
Mortgage History
| Date | Status | Borrower | Loan Amount |
|---|---|---|---|
| Closed | Thompson Edward | $99,877 | |
| Closed | Thompson Edward | $151,000 | |
| Closed | Thompson Edward | $169,850 |
Source: Public Records
Tax History Compared to Growth
Tax History
| Year | Tax Paid | Tax Assessment Tax Assessment Total Assessment is a certain percentage of the fair market value that is determined by local assessors to be the total taxable value of land and additions on the property. | Land | Improvement |
|---|---|---|---|---|
| 2025 | $8,015 | $234,640 | $88,200 | $146,440 |
| 2024 | $7,816 | $234,640 | $88,200 | $146,440 |
| 2023 | $7,466 | $234,640 | $88,200 | $146,440 |
| 2022 | $7,181 | $185,880 | $88,200 | $97,680 |
| 2021 | $7,181 | $185,880 | $88,200 | $97,680 |
| 2020 | $6,894 | $185,880 | $88,200 | $97,680 |
| 2019 | $6,937 | $185,880 | $88,200 | $97,680 |
| 2018 | $6,987 | $185,880 | $88,200 | $97,680 |
| 2017 | $6,623 | $170,880 | $85,970 | $84,910 |
| 2016 | $6,343 | $170,880 | $85,970 | $84,910 |
| 2015 | $6,343 | $170,880 | $85,970 | $84,910 |
| 2014 | $6,346 | $170,880 | $85,960 | $84,920 |
Source: Public Records
Map
Nearby Homes
- 247 Old Farms Rd
- 324 Firetown Rd
- 9 Gretel Ln
- 2 North Dr
- 4 Stonewall Dr
- 25 Barry Ln
- 26 Winterset Ln
- 7R Stonewall Dr
- 45 Hoskins Rd
- 5 Washington Dr
- 87 Cambridge Ct
- 14 Gordon St
- 14 Brettonwood Dr
- 40 Firetown Rd Unit 39
- 18 Meadowlark Rd
- 27 Ridge Rd
- 48 Library Ln Unit 48
- 47 Salmon Brook St
- 19 Simsbury Landing
- 537 Cherry Brook Rd