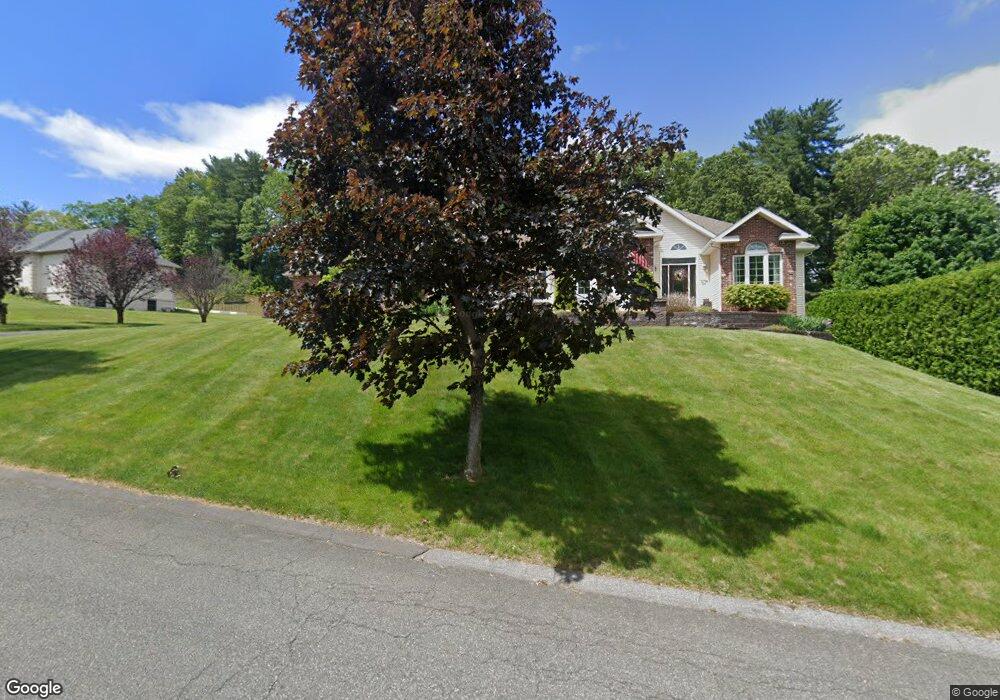
21 Sylvan Dr Westfield, MA 01085
Estimated Value: $616,000 - $628,447
3
Beds
2
Baths
1,974
Sq Ft
$314/Sq Ft
Est. Value
About This Home
This home is located at 21 Sylvan Dr, Westfield, MA 01085 and is currently estimated at $620,612, approximately $314 per square foot. 21 Sylvan Dr is a home located in Hampden County with nearby schools including Westfield High School and Saint Mary High School.
Ownership History
Date
Name
Owned For
Owner Type
Purchase Details
Closed on
Jul 24, 2013
Sold by
Lockery Alan B
Bought by
Lockery Alan B and Lockery Linda A
Current Estimated Value
Purchase Details
Closed on
Feb 12, 2009
Sold by
Belco Constr Co Inc
Bought by
Lockery Alan B
Home Financials for this Owner
Home Financials are based on the most recent Mortgage that was taken out on this home.
Original Mortgage
$250,000
Interest Rate
5.26%
Mortgage Type
Purchase Money Mortgage
Create a Home Valuation Report for This Property
The Home Valuation Report is an in-depth analysis detailing your home's value as well as a comparison with similar homes in the area
Home Values in the Area
Average Home Value in this Area
Purchase History
| Date | Buyer | Sale Price | Title Company |
|---|---|---|---|
| Lockery Alan B | -- | -- | |
| Lockery Alan B | $365,000 | -- |
Source: Public Records
Mortgage History
| Date | Status | Borrower | Loan Amount |
|---|---|---|---|
| Previous Owner | Lockery Alan B | $250,000 |
Source: Public Records
Tax History
| Year | Tax Paid | Tax Assessment Tax Assessment Total Assessment is a certain percentage of the fair market value that is determined by local assessors to be the total taxable value of land and additions on the property. | Land | Improvement |
|---|---|---|---|---|
| 2025 | $9,114 | $600,400 | $150,200 | $450,200 |
| 2024 | $9,168 | $574,100 | $136,700 | $437,400 |
| 2023 | $8,883 | $542,800 | $130,100 | $412,700 |
| 2022 | $8,883 | $480,400 | $116,100 | $364,300 |
| 2021 | $8,617 | $456,400 | $109,500 | $346,900 |
| 2020 | $8,470 | $440,000 | $109,500 | $330,500 |
| 2019 | $8,283 | $421,100 | $104,300 | $316,800 |
| 2018 | $7,740 | $399,800 | $104,300 | $295,500 |
| 2017 | $7,539 | $388,200 | $105,700 | $282,500 |
| 2016 | $7,547 | $388,200 | $105,700 | $282,500 |
| 2015 | $6,975 | $376,200 | $105,700 | $270,500 |
| 2014 | $5,223 | $376,200 | $105,700 | $270,500 |
Source: Public Records
Map
Nearby Homes
- 11 Laurel Terrace
- 5 Bancroft St
- 76 Cardinal Ln
- 57 Falley Dr
- 12 Laro Rd
- 0 Feeding Hills Rd
- 929 Shaker Rd Unit 18
- 189 Springfield Rd Unit 23
- 0 E Mountain Rd
- 2 Cycle St
- 65 Old Farm Rd
- 18 Noble St
- 242 Eastwood Dr
- 120 Woodcliff Dr
- 63 George St
- 103 Woodcliff Dr
- 25 Dubois St
- 16 Squawfield Rd
- 44 Tannery Rd
- 100 Meadow St
Your Personal Tour Guide
Ask me questions while you tour the home.