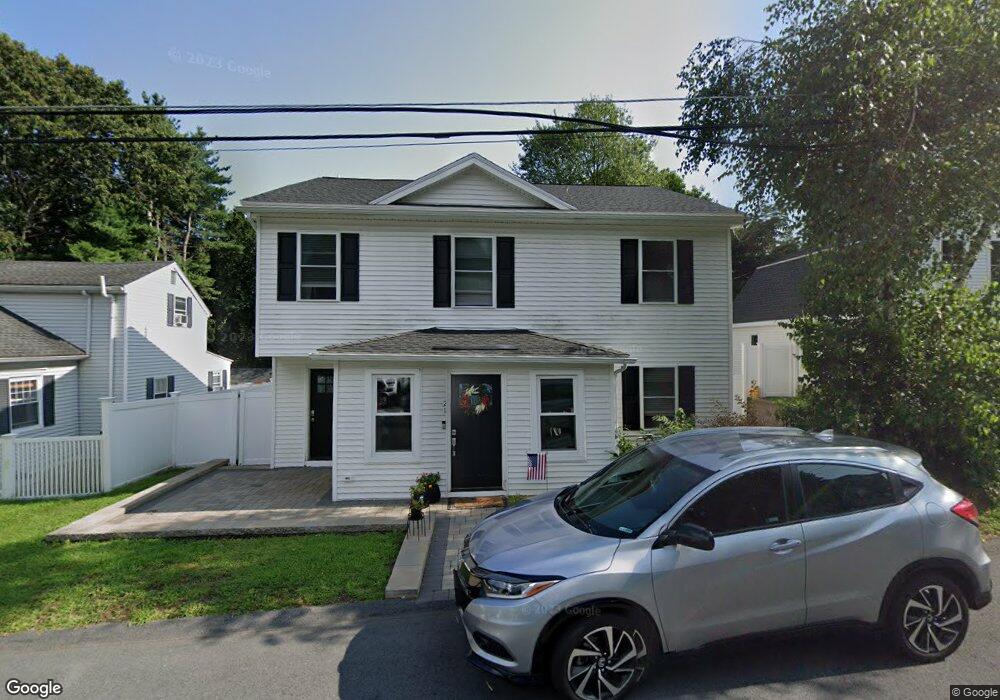
21 Topping Rd Unit a Andover, MA 01810
Shawsheen Heights NeighborhoodEstimated Value: $595,000 - $725,000
3
Beds
1
Bath
1,340
Sq Ft
$496/Sq Ft
Est. Value
About This Home
This home is located at 21 Topping Rd Unit a, Andover, MA 01810 and is currently estimated at $664,128, approximately $495 per square foot. 21 Topping Rd Unit a is a home located in Essex County with nearby schools including West Elementary School, Andover West Middle School, and Andover High School.
Ownership History
Date
Name
Owned For
Owner Type
Purchase Details
Closed on
Jan 7, 2021
Sold by
Sullivan Ryan L and Sullivan Kelley L
Bought by
Sullivan Ryan L
Current Estimated Value
Purchase Details
Closed on
Nov 25, 2003
Sold by
Riley-Hudon Randi and Hudon Timothy C
Bought by
Heller Arnold J and Heller Sherron
Home Financials for this Owner
Home Financials are based on the most recent Mortgage that was taken out on this home.
Original Mortgage
$228,000
Interest Rate
5.98%
Mortgage Type
Purchase Money Mortgage
Purchase Details
Closed on
Dec 15, 2000
Sold by
Mcvay Kathleen B
Bought by
Riley Randi M and Hudon Timothy C
Purchase Details
Closed on
Jun 23, 2000
Sold by
Sorensen Pamela
Bought by
Mcvay Kathleen B
Purchase Details
Closed on
Mar 19, 1999
Sold by
Lathrop Christopher W
Bought by
Sorensen Pamela
Purchase Details
Closed on
Mar 12, 1996
Sold by
Roche Brendan P
Bought by
Lathrop Christopher W
Create a Home Valuation Report for This Property
The Home Valuation Report is an in-depth analysis detailing your home's value as well as a comparison with similar homes in the area
Home Values in the Area
Average Home Value in this Area
Purchase History
| Date | Buyer | Sale Price | Title Company |
|---|---|---|---|
| Sullivan Ryan L | -- | None Available | |
| Sullivan Ryan L | -- | None Available | |
| Heller Arnold J | $285,000 | -- | |
| Heller Arnold J | $285,000 | -- | |
| Riley Randi M | $207,000 | -- | |
| Riley Randi M | $207,000 | -- | |
| Mcvay Kathleen B | $187,500 | -- | |
| Mcvay Kathleen B | $187,500 | -- | |
| Sorensen Pamela | $165,000 | -- | |
| Sorensen Pamela | $165,000 | -- | |
| Lathrop Christopher W | $135,000 | -- | |
| Lathrop Christopher W | $135,000 | -- |
Source: Public Records
Mortgage History
| Date | Status | Borrower | Loan Amount |
|---|---|---|---|
| Previous Owner | Heller Arnold J | $228,000 |
Source: Public Records
Tax History
| Year | Tax Paid | Tax Assessment Tax Assessment Total Assessment is a certain percentage of the fair market value that is determined by local assessors to be the total taxable value of land and additions on the property. | Land | Improvement |
|---|---|---|---|---|
| 2024 | $7,348 | $570,500 | $238,100 | $332,400 |
| 2023 | $7,027 | $514,400 | $214,400 | $300,000 |
| 2022 | $6,723 | $460,500 | $186,400 | $274,100 |
| 2021 | $6,443 | $421,400 | $169,500 | $251,900 |
| 2020 | $4,875 | $324,800 | $165,200 | $159,600 |
| 2019 | $5,152 | $337,400 | $160,300 | $177,100 |
| 2018 | $4,958 | $317,000 | $154,000 | $163,000 |
| 2017 | $4,610 | $303,700 | $151,100 | $152,600 |
| 2016 | $4,501 | $303,700 | $151,100 | $152,600 |
| 2015 | $4,322 | $288,700 | $145,100 | $143,600 |
Source: Public Records
Map
Nearby Homes
- 10 Dartmouth Rd
- 116 Weare St
- 102 Weare St
- 12B Stevens St
- 34 Martingale Ln Unit 34
- 53 Martingale Ln
- 21 Clubview Dr Unit 21
- 354 N Main St Unit 204
- 43 Gorham St
- 42 York St
- 11 Swan Ln Unit 11
- 11 W Hawley St
- 16 Balmoral St Unit 214
- 24 Inman St Unit 4
- 34 Beaconsfield St
- 341 S Broadway- Parcel II
- 87-87A Brookfield St
- 17 Carisbrooke St
- 25 Clubview Dr Unit 25
- 28 Stirling St
Your Personal Tour Guide
Ask me questions while you tour the home.