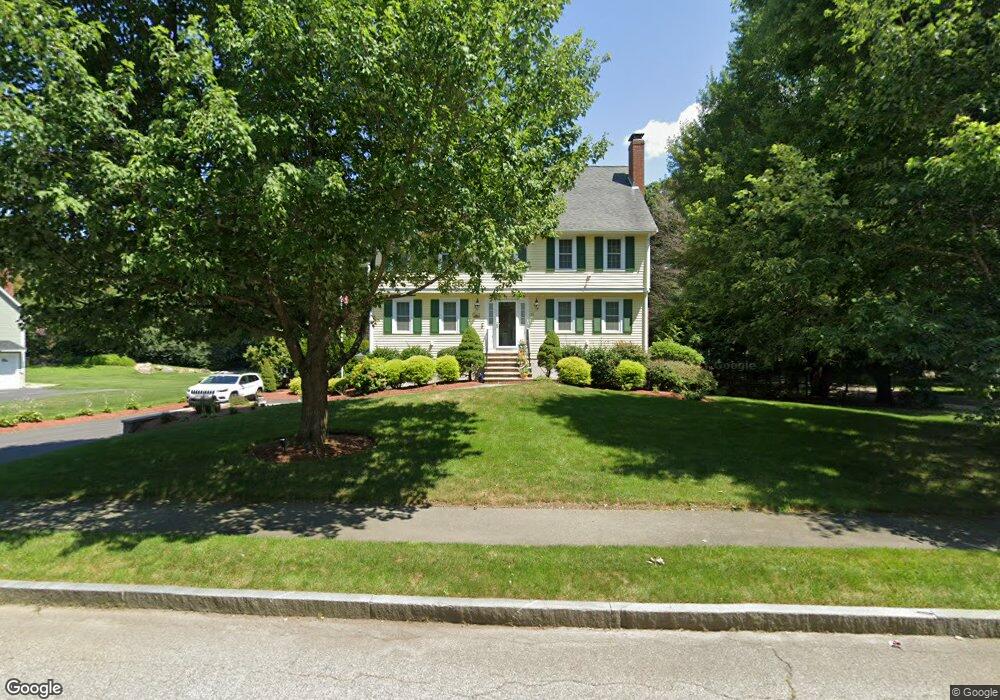
21 Towpath Dr Unit R Wilmington, MA 01887
Estimated Value: $1,126,000 - $1,308,000
5
Beds
4
Baths
2,642
Sq Ft
$457/Sq Ft
Est. Value
About This Home
This home is located at 21 Towpath Dr Unit R, Wilmington, MA 01887 and is currently estimated at $1,206,246, approximately $456 per square foot. 21 Towpath Dr Unit R is a home located in Middlesex County with nearby schools including Wilmington Middle School, Wilmington High School, and Abundant Life Christian School and Childcare.
Ownership History
Date
Name
Owned For
Owner Type
Purchase Details
Closed on
Dec 1, 2005
Sold by
Jones Gina M and Jones Timothy P
Bought by
Silva Edward J
Current Estimated Value
Home Financials for this Owner
Home Financials are based on the most recent Mortgage that was taken out on this home.
Original Mortgage
$560,000
Outstanding Balance
$310,525
Interest Rate
6.14%
Mortgage Type
Purchase Money Mortgage
Estimated Equity
$895,721
Purchase Details
Closed on
Aug 27, 2004
Sold by
Jones Timothy P
Bought by
Jones Gina M and Jones Timothy P
Purchase Details
Closed on
Aug 30, 1993
Sold by
Northeastern Dev Corp
Bought by
Jones Timothy P and Jones Jerellen
Home Financials for this Owner
Home Financials are based on the most recent Mortgage that was taken out on this home.
Original Mortgage
$200,000
Interest Rate
7.06%
Mortgage Type
Purchase Money Mortgage
Create a Home Valuation Report for This Property
The Home Valuation Report is an in-depth analysis detailing your home's value as well as a comparison with similar homes in the area
Home Values in the Area
Average Home Value in this Area
Purchase History
| Date | Buyer | Sale Price | Title Company |
|---|---|---|---|
| Silva Edward J | $760,000 | -- | |
| Jones Gina M | -- | -- | |
| Jones Timothy P | $259,900 | -- |
Source: Public Records
Mortgage History
| Date | Status | Borrower | Loan Amount |
|---|---|---|---|
| Open | Silva Edward J | $560,000 | |
| Previous Owner | Jones Timothy P | $24,000 | |
| Previous Owner | Jones Timothy P | $200,000 |
Source: Public Records
Tax History Compared to Growth
Tax History
| Year | Tax Paid | Tax Assessment Tax Assessment Total Assessment is a certain percentage of the fair market value that is determined by local assessors to be the total taxable value of land and additions on the property. | Land | Improvement |
|---|---|---|---|---|
| 2025 | $12,389 | $1,082,000 | $372,800 | $709,200 |
| 2024 | $12,063 | $1,055,400 | $372,800 | $682,600 |
| 2023 | $11,086 | $928,500 | $317,400 | $611,100 |
| 2022 | $10,498 | $805,700 | $264,500 | $541,200 |
| 2021 | $11,116 | $803,200 | $240,200 | $563,000 |
| 2020 | $10,875 | $800,800 | $240,200 | $560,600 |
| 2019 | $7,593 | $783,300 | $234,500 | $548,800 |
| 2018 | $10,908 | $757,000 | $223,200 | $533,800 |
| 2017 | $10,905 | $754,700 | $232,500 | $522,200 |
| 2016 | $10,137 | $692,900 | $221,300 | $471,600 |
| 2015 | $9,734 | $677,400 | $221,300 | $456,100 |
| 2014 | $9,125 | $640,800 | $210,700 | $430,100 |
Source: Public Records
Map
Nearby Homes
- 11 Patchs Pond Ln
- 7 Cross St (Units 201 & 202)
- 7 Cross St Unit 306
- 7 Cross St Unit 304
- 7 Cross St Unit 205
- 61 Lowell St
- 9 Parker St
- 414-418 Main St
- 17 Molloy Rd
- 142 Burlington Ave
- 14 Roberts Rd
- 62 Adams St
- 27 Fairview Ave
- 1 March Rd
- 96 Middlesex Ave
- 203 Lowell St Unit 119
- 203 Lowell St Unit 115
- 203 Lowell St Unit 304
- 203 Lowell St Unit 220
- 203 Lowell St Unit 103