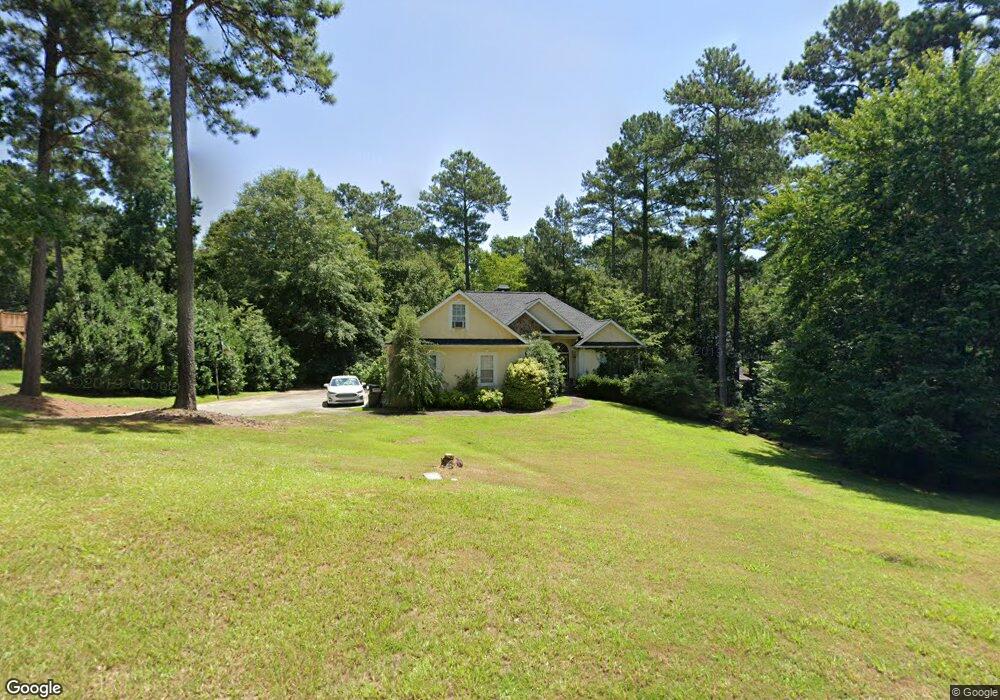
21 Tremont St Sharpsburg, GA 30277
Estimated Value: $375,000 - $491,000
3
Beds
2
Baths
1,867
Sq Ft
$225/Sq Ft
Est. Value
About This Home
This home is located at 21 Tremont St, Sharpsburg, GA 30277 and is currently estimated at $420,046, approximately $224 per square foot. 21 Tremont St is a home located in Coweta County with nearby schools including Canongate Elementary School, Madras Middle School, and Northgate High School.
Ownership History
Date
Name
Owned For
Owner Type
Purchase Details
Closed on
Jun 22, 2022
Sold by
Sims Mary Elizabeth
Bought by
Aldredge Hannah Michele and Arrington Cody Nathaniel
Current Estimated Value
Home Financials for this Owner
Home Financials are based on the most recent Mortgage that was taken out on this home.
Original Mortgage
$40,000
Outstanding Balance
$28,854
Interest Rate
5.1%
Mortgage Type
New Conventional
Estimated Equity
$391,192
Purchase Details
Closed on
Jul 6, 2016
Sold by
Suntrust Bank Trustee
Bought by
Sims Ellis Redding and Sims Mary Elizabeth
Purchase Details
Closed on
Apr 8, 1994
Bought by
Moore Scott and Moore Suzann
Purchase Details
Closed on
Aug 11, 1993
Bought by
Moore Scott and Moore Suzann
Purchase Details
Closed on
Apr 1, 1992
Bought by
Rockport Inc
Purchase Details
Closed on
Mar 31, 1986
Bought by
Cannon Gate Associat
Create a Home Valuation Report for This Property
The Home Valuation Report is an in-depth analysis detailing your home's value as well as a comparison with similar homes in the area
Home Values in the Area
Average Home Value in this Area
Purchase History
| Date | Buyer | Sale Price | Title Company |
|---|---|---|---|
| Aldredge Hannah Michele | $40,000 | -- | |
| Sims Ellis Redding | -- | -- | |
| Moore Scott | $19,000 | -- | |
| Moore Scott | $19,000 | -- | |
| Rockport Inc | $295,900 | -- | |
| Cannon Gate Associat | -- | -- |
Source: Public Records
Mortgage History
| Date | Status | Borrower | Loan Amount |
|---|---|---|---|
| Open | Aldredge Hannah Michele | $40,000 |
Source: Public Records
Tax History Compared to Growth
Tax History
| Year | Tax Paid | Tax Assessment Tax Assessment Total Assessment is a certain percentage of the fair market value that is determined by local assessors to be the total taxable value of land and additions on the property. | Land | Improvement |
|---|---|---|---|---|
| 2025 | $3,826 | $166,777 | $30,000 | $136,777 |
| 2024 | $3,825 | $169,357 | $30,000 | $139,357 |
| 2023 | $3,825 | $160,882 | $22,000 | $138,882 |
| 2022 | $3,707 | $150,497 | $22,000 | $128,497 |
| 2021 | $3,307 | $125,632 | $22,000 | $103,632 |
| 2020 | $3,329 | $125,632 | $22,000 | $103,632 |
| 2019 | $3,321 | $113,447 | $12,000 | $101,447 |
| 2018 | $3,326 | $113,447 | $12,000 | $101,447 |
| 2017 | $3,091 | $105,459 | $12,000 | $93,459 |
| 2016 | $2,918 | $105,459 | $12,000 | $93,459 |
| 2015 | $2,598 | $95,874 | $12,000 | $83,874 |
| 2014 | $2,523 | $93,874 | $10,000 | $83,874 |
Source: Public Records
Map
Nearby Homes
- 259 Strathmore Dr Unit 3
- 10 Monteray Ct
- 40 Wenham Ln
- 12 Race Point Way
- 70 N Strathmore Dr
- 131 Cannongate Cir
- 20 Skipton Ct
- 125 Cannongate Cir
- 319 Beaconsfield Dr
- 95 Tyler Woods Dr
- 25 Sycamore Way
- 121 Northwoods Rd
- 972 Raymond Hill Rd
- 46 I W Brooks Rd
- 2043 Fischer Rd
- 2039 Fischer Rd
- 127 Northgate Preserve Dr
- 851 Raymond Hill Rd
- 75 Tomahawk Dr
- 9 Warrior Way
- 364 Strathmore Dr Unit 62
- 364 Strathmore Dr
- 31 Tremont St
- 0 Tremont St Unit 8827396
- 346 Strathmore Dr
- 400 Strathmore Dr
- 359 Strathmore Dr Unit 3
- 32 Tremont St
- 347 Strathmore Dr
- 55 Tremont St
- 87 Tremont St Unit 3
- 322 Strathmore Dr Unit 3
- 322 Strathmore Dr
- 387 Strathmore Dr Unit 5
- 42 Tremont St Unit 3
- 349 Strathmore Dr Unit 3
- 408 Strathmore Dr
- 397 Strathmore Dr
- 12 Banbury Cross Unit 3
- 302 Strathmore Dr