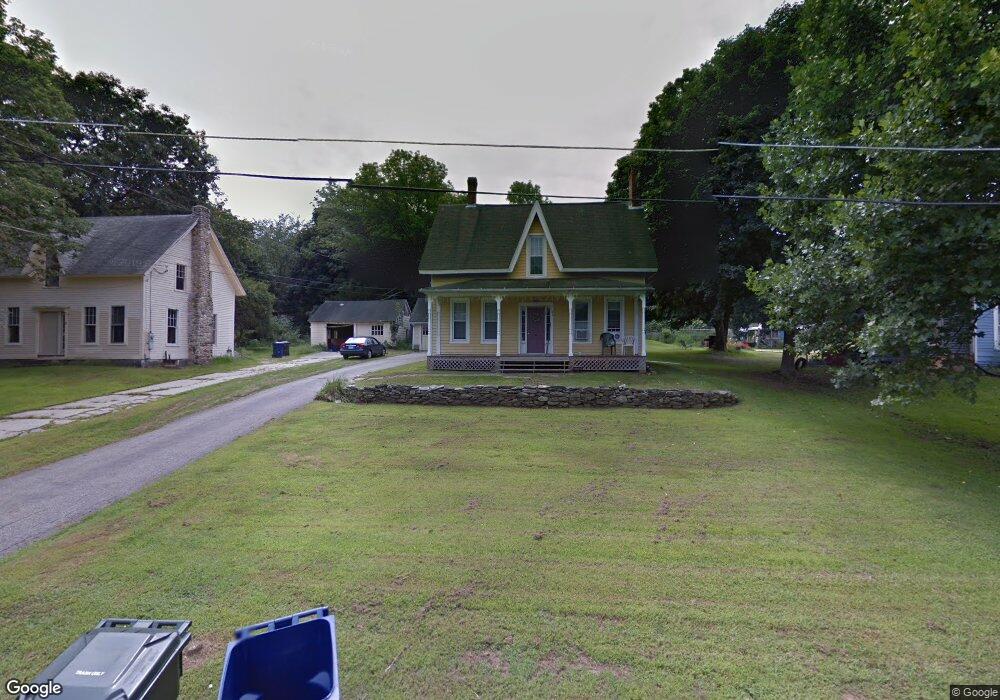
21 Type Rd South Windham, CT 06266
Estimated Value: $267,000 - $317,000
3
Beds
2
Baths
1,134
Sq Ft
$255/Sq Ft
Est. Value
About This Home
This home is located at 21 Type Rd, South Windham, CT 06266 and is currently estimated at $289,397, approximately $255 per square foot. 21 Type Rd is a home located in Windham County with nearby schools including Windham Middle School, Windham High School, and St Mary St Joseph School.
Ownership History
Date
Name
Owned For
Owner Type
Purchase Details
Closed on
Jan 29, 2001
Sold by
Bartholomew William and Buchas Joseph
Bought by
Terwilliger Melissa
Current Estimated Value
Purchase Details
Closed on
Oct 29, 1999
Sold by
Stygar Kirk and Stygar Julie
Bought by
Bartholomeu William and Bodzas Joseph
Purchase Details
Closed on
Dec 1, 1995
Sold by
Scribner Ethel
Bought by
Stygar Kirk and Stygar Julie
Create a Home Valuation Report for This Property
The Home Valuation Report is an in-depth analysis detailing your home's value as well as a comparison with similar homes in the area
Home Values in the Area
Average Home Value in this Area
Purchase History
| Date | Buyer | Sale Price | Title Company |
|---|---|---|---|
| Terwilliger Melissa | $118,000 | -- | |
| Bartholomeu William | $112,000 | -- | |
| Stygar Kirk | $55,000 | -- |
Source: Public Records
Mortgage History
| Date | Status | Borrower | Loan Amount |
|---|---|---|---|
| Open | Stygar Kirk | $147,000 | |
| Closed | Stygar Kirk | $28,813 | |
| Closed | Stygar Kirk | $148,500 |
Source: Public Records
Tax History
| Year | Tax Paid | Tax Assessment Tax Assessment Total Assessment is a certain percentage of the fair market value that is determined by local assessors to be the total taxable value of land and additions on the property. | Land | Improvement |
|---|---|---|---|---|
| 2025 | $4,499 | $150,730 | $29,420 | $121,310 |
| 2024 | $4,505 | $150,730 | $29,420 | $121,310 |
| 2023 | $3,659 | $94,290 | $25,590 | $68,700 |
| 2022 | $3,565 | $94,290 | $25,590 | $68,700 |
| 2021 | $3,716 | $94,290 | $25,590 | $68,700 |
| 2020 | $3,668 | $94,290 | $25,590 | $68,700 |
| 2019 | $3,621 | $94,290 | $25,590 | $68,700 |
| 2017 | $3,716 | $96,450 | $22,930 | $73,520 |
| 2015 | $3,313 | $96,450 | $22,930 | $73,520 |
| 2014 | $3,126 | $96,450 | $22,930 | $73,520 |
Source: Public Records
Map
Nearby Homes
- 40 Sanitarium Rd
- 121 Highland View Dr
- 9 Highland View Dr
- 235 S Windham Rd
- 170 Windham Center Rd
- 91 Insalaco Dr
- 5 Autumn Ridge
- 121 Insalaco Dr
- 5 Insalaco Dr
- 39 S Windham Rd
- 80 Old Plains Rd
- 363 Windham Rd
- 50 Selden St
- 34 N Windham Rd
- 11 Woodland Dr
- 119 Quercus Ave
- 96 Mcdermott Ave
- 253 Brick Top Rd
- 139 South St
- 15 Cracow Ave
Your Personal Tour Guide
Ask me questions while you tour the home.