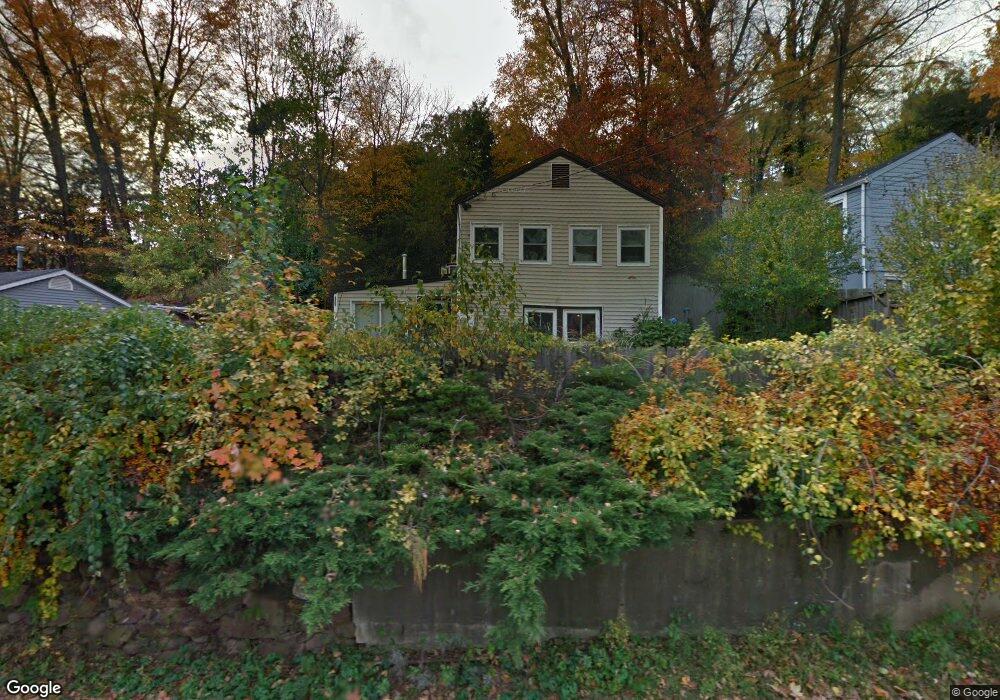
21 Underhill Rd Sandy Hook, CT 06482
Estimated Value: $369,471 - $436,000
3
Beds
2
Baths
1,315
Sq Ft
$304/Sq Ft
Est. Value
About This Home
This home is located at 21 Underhill Rd, Sandy Hook, CT 06482 and is currently estimated at $400,118, approximately $304 per square foot. 21 Underhill Rd is a home located in Fairfield County with nearby schools including Sandy Hook Elementary School, Reed Intermediate School, and Newtown Middle School.
Ownership History
Date
Name
Owned For
Owner Type
Purchase Details
Closed on
Jun 25, 2010
Sold by
Schulman Jared D
Bought by
Coscia Elizabeth Ashle
Current Estimated Value
Home Financials for this Owner
Home Financials are based on the most recent Mortgage that was taken out on this home.
Original Mortgage
$173,600
Outstanding Balance
$116,849
Interest Rate
4.98%
Estimated Equity
$283,269
Purchase Details
Closed on
Feb 25, 2010
Sold by
Kempfer Carol
Bought by
Scholman Jared D
Purchase Details
Closed on
Sep 25, 2009
Sold by
Kempfer Carrol
Bought by
Schulman Jared D
Purchase Details
Closed on
May 22, 2007
Sold by
Binder Gerhard
Bought by
21 Under Hill Partner
Purchase Details
Closed on
Jul 1, 2002
Sold by
Bell Carolyn
Bought by
Binder Gerhard
Purchase Details
Closed on
Sep 8, 2000
Sold by
Dougherty Edward J and Dougherty Debra J
Bought by
Bell Carolyn
Create a Home Valuation Report for This Property
The Home Valuation Report is an in-depth analysis detailing your home's value as well as a comparison with similar homes in the area
Home Values in the Area
Average Home Value in this Area
Purchase History
| Date | Buyer | Sale Price | Title Company |
|---|---|---|---|
| Coscia Elizabeth Ashle | $217,000 | -- | |
| Coscia Elizabeth Ashle | $217,000 | -- | |
| Scholman Jared D | -- | -- | |
| Scholman Jared D | -- | -- | |
| Schulman Jared D | $245,000 | -- | |
| Schulman Jared D | $245,000 | -- | |
| 21 Under Hill Partner | $287,000 | -- | |
| 21 Under Hill Partner | $287,000 | -- | |
| Binder Gerhard | $167,500 | -- | |
| Binder Gerhard | $167,500 | -- | |
| Bell Carolyn | $134,000 | -- | |
| Bell Carolyn | $134,000 | -- |
Source: Public Records
Mortgage History
| Date | Status | Borrower | Loan Amount |
|---|---|---|---|
| Open | Bell Carolyn | $173,600 | |
| Closed | Bell Carolyn | $173,600 |
Source: Public Records
Tax History Compared to Growth
Tax History
| Year | Tax Paid | Tax Assessment Tax Assessment Total Assessment is a certain percentage of the fair market value that is determined by local assessors to be the total taxable value of land and additions on the property. | Land | Improvement |
|---|---|---|---|---|
| 2025 | $5,906 | $205,490 | $37,400 | $168,090 |
| 2024 | $5,542 | $205,490 | $37,400 | $168,090 |
| 2023 | $5,392 | $205,490 | $37,400 | $168,090 |
| 2022 | $4,822 | $139,080 | $41,030 | $98,050 |
| 2021 | $4,819 | $139,080 | $41,030 | $98,050 |
| 2020 | $4,834 | $139,080 | $41,030 | $98,050 |
| 2019 | $4,155 | $119,500 | $41,030 | $78,470 |
| 2018 | $4,092 | $119,500 | $41,030 | $78,470 |
| 2017 | $3,920 | $115,730 | $58,700 | $57,030 |
| 2016 | $3,889 | $115,730 | $58,700 | $57,030 |
| 2015 | $3,827 | $115,730 | $58,700 | $57,030 |
| 2014 | $3,855 | $115,730 | $58,700 | $57,030 |
Source: Public Records
Map
Nearby Homes
- 89 Alpine Dr
- 22 Hemlock Trail
- 30 Capitol Dr
- 69 Engleside Terrace
- 105 Lower Fish Rock Rd
- 140 Lake Ridge Rd
- 297 Manor Rd
- 41 Chipmunk Trail
- 225 Manor Rd
- 164 Ichabod Rd
- 17 Buttonball Dr
- 493 Berkshire Rd
- 600 Berkshire Rd
- 27 Pole Bridge Rd
- 22 Misty Vale Rd
- 683 Berkshire Rd
- 30 Cedarhurst Trail
- 3 Cherry Heights Terrace
- 7 Ford Rd
- 23 Fawnwood Rd
- 25 Underhill Rd
- 15 Underhill Rd
- 25 Round Hill Rd
- 31 Underhill Rd
- 17 Round Hill Rd
- 29 Round Hill Rd
- 7 Underhill Rd
- 35 Round Hill Rd
- 22 Underhill Rd
- 34 Underhill Rd
- 30 Underhill Rd
- 38 Underhill Rd
- 10 Underhill Rd
- 15 Round Hill Rd
- 14 Underhill Rd
- 35 Underhill Rd
- 3 Underhill Rd
- 46 Underhill Rd
- 11 Round Hill Rd
- 8 Underhill Rd