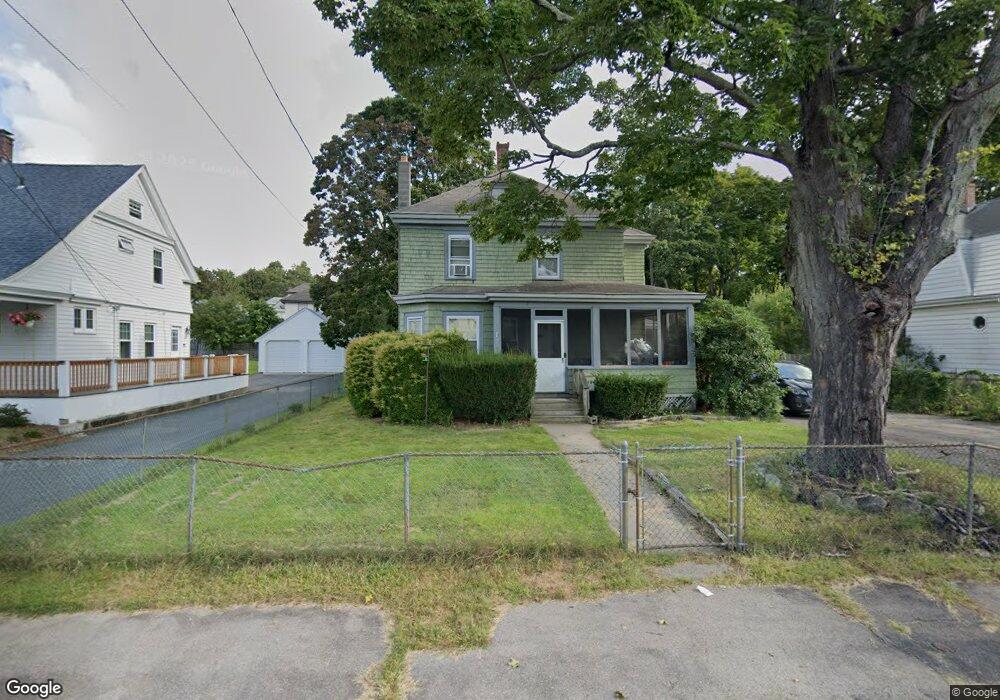
21 Upland St Holbrook, MA 02343
Estimated Value: $521,254 - $574,000
3
Beds
2
Baths
1,422
Sq Ft
$383/Sq Ft
Est. Value
About This Home
This home is located at 21 Upland St, Holbrook, MA 02343 and is currently estimated at $544,814, approximately $383 per square foot. 21 Upland St is a home located in Norfolk County with nearby schools including John F. Kennedy Elementary School, Holbrook Middle High School, and Boston Higashi School.
Ownership History
Date
Name
Owned For
Owner Type
Purchase Details
Closed on
Jul 15, 2008
Sold by
Hsbc Bank Usa
Bought by
Labrecque Kevin and Labrecque Martha
Current Estimated Value
Purchase Details
Closed on
Mar 27, 2008
Sold by
Stock Lisa M and Hsbc Bank Usa
Bought by
Hsbc Bank Usa
Purchase Details
Closed on
Mar 29, 2000
Sold by
Distasio Stephen
Bought by
Stock Michael F and Stock Lisa M
Purchase Details
Closed on
Feb 9, 1999
Sold by
Knapp Carl P and Knapp Anita M
Bought by
Distasio Stephen
Purchase Details
Closed on
Jan 16, 1987
Sold by
Robinson Neal F
Bought by
Knapp Carl P
Create a Home Valuation Report for This Property
The Home Valuation Report is an in-depth analysis detailing your home's value as well as a comparison with similar homes in the area
Home Values in the Area
Average Home Value in this Area
Purchase History
| Date | Buyer | Sale Price | Title Company |
|---|---|---|---|
| Labrecque Kevin | $230,000 | -- | |
| Hsbc Bank Usa | $246,913 | -- | |
| Stock Michael F | $195,000 | -- | |
| Distasio Stephen | $150,000 | -- | |
| Knapp Carl P | $117,000 | -- |
Source: Public Records
Mortgage History
| Date | Status | Borrower | Loan Amount |
|---|---|---|---|
| Open | Knapp Carl P | $230,573 | |
| Closed | Knapp Carl P | $228,648 |
Source: Public Records
Tax History Compared to Growth
Tax History
| Year | Tax Paid | Tax Assessment Tax Assessment Total Assessment is a certain percentage of the fair market value that is determined by local assessors to be the total taxable value of land and additions on the property. | Land | Improvement |
|---|---|---|---|---|
| 2025 | $58 | $436,700 | $216,500 | $220,200 |
| 2024 | $5,359 | $398,700 | $196,800 | $201,900 |
| 2023 | $5,686 | $369,700 | $179,000 | $190,700 |
| 2022 | $5,341 | $323,900 | $155,600 | $168,300 |
| 2021 | $5,231 | $303,800 | $145,400 | $158,400 |
| 2020 | $5,318 | $289,500 | $137,400 | $152,100 |
| 2019 | $5,361 | $275,500 | $127,100 | $148,400 |
| 2018 | $5,230 | $253,000 | $109,600 | $143,400 |
| 2017 | $5,133 | $245,600 | $109,600 | $136,000 |
| 2016 | $4,388 | $223,400 | $98,600 | $124,800 |
| 2015 | $4,091 | $214,400 | $94,600 | $119,800 |
| 2014 | $4,024 | $214,400 | $94,600 | $119,800 |
Source: Public Records
Map
Nearby Homes
- 12 Hamilton Way
- 38 Stephen Dr
- 5 Brookville Ave
- 719 S Franklin St Unit L Block 1
- 719 S Franklin St Unit D Block 1
- 719 S Franklin St Unit C Block 1
- 68 Spring St
- 261 Jon Dr
- 18 Brookfield Dr
- 28 Border Rd
- 285 Hovendon Ave
- 55 Border Rd
- 170 Elsie Rd
- 29 Belair Dr
- 63 Juniper Rd
- 13 Mayflower Rd
- 690 N Quincy St
- 279 Howard St
- 60 Bonney St
- 105 Oscar Ave