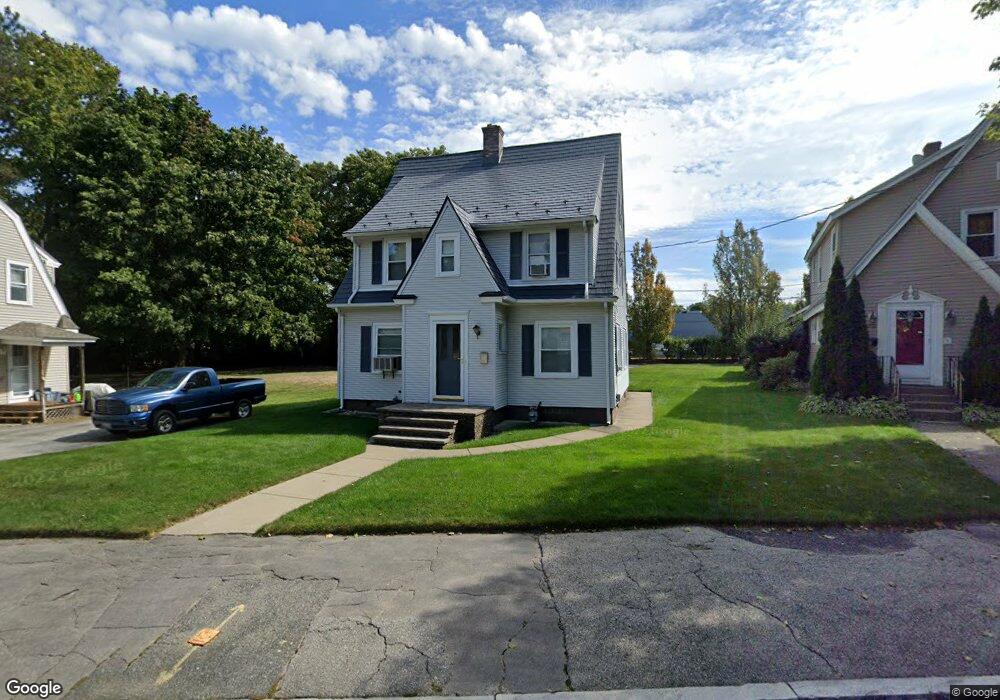
21 Varnum St Worcester, MA 01603
Webster Square NeighborhoodEstimated Value: $345,786 - $423,000
4
Beds
2
Baths
840
Sq Ft
$457/Sq Ft
Est. Value
About This Home
This home is located at 21 Varnum St, Worcester, MA 01603 and is currently estimated at $383,697, approximately $456 per square foot. 21 Varnum St is a home located in Worcester County with nearby schools including Gates Lane, Jacob Hiatt Magnet School, and Chandler Magnet.
Ownership History
Date
Name
Owned For
Owner Type
Purchase Details
Closed on
Sep 1, 1987
Sold by
Rusche James R
Bought by
Alexander L F
Current Estimated Value
Home Financials for this Owner
Home Financials are based on the most recent Mortgage that was taken out on this home.
Original Mortgage
$103,000
Interest Rate
10.24%
Mortgage Type
Purchase Money Mortgage
Create a Home Valuation Report for This Property
The Home Valuation Report is an in-depth analysis detailing your home's value as well as a comparison with similar homes in the area
Home Values in the Area
Average Home Value in this Area
Purchase History
| Date | Buyer | Sale Price | Title Company |
|---|---|---|---|
| Alexander L F | $114,500 | -- |
Source: Public Records
Mortgage History
| Date | Status | Borrower | Loan Amount |
|---|---|---|---|
| Closed | Alexander L F | $103,000 |
Source: Public Records
Tax History Compared to Growth
Tax History
| Year | Tax Paid | Tax Assessment Tax Assessment Total Assessment is a certain percentage of the fair market value that is determined by local assessors to be the total taxable value of land and additions on the property. | Land | Improvement |
|---|---|---|---|---|
| 2025 | $3,986 | $302,200 | $91,100 | $211,100 |
| 2024 | $3,835 | $278,900 | $91,100 | $187,800 |
| 2023 | $3,693 | $257,500 | $79,200 | $178,300 |
| 2022 | $3,416 | $224,600 | $63,300 | $161,300 |
| 2021 | $3,240 | $199,000 | $50,700 | $148,300 |
| 2020 | $3,101 | $182,400 | $50,300 | $132,100 |
| 2019 | $2,970 | $165,000 | $43,900 | $121,100 |
| 2018 | $2,971 | $157,100 | $43,900 | $113,200 |
| 2017 | $2,808 | $146,100 | $43,900 | $102,200 |
| 2016 | $2,786 | $135,200 | $32,100 | $103,100 |
| 2015 | $2,713 | $135,200 | $32,100 | $103,100 |
| 2014 | $2,642 | $135,200 | $32,100 | $103,100 |
Source: Public Records
Map
Nearby Homes
- 114 Henshaw St
- 170 Stafford St
- 35 Genessee St Unit I
- 68 Crest Cir
- 21 Healy Rd
- 53 James St
- 45 Wildwood Ave
- 28 Baker St
- 23 Lakewood St
- 76 Parsons Hill Dr Unit A
- 24 Ludlow St
- 19 Monticello Dr
- 13 Merchant St
- 40 Ludlow St
- 40 Lakewood St
- 2 Keen St
- 4 S Edlin St
- 1511 Main St Unit C405
- 1511 Main St Unit C306
- 27 Havana Rd