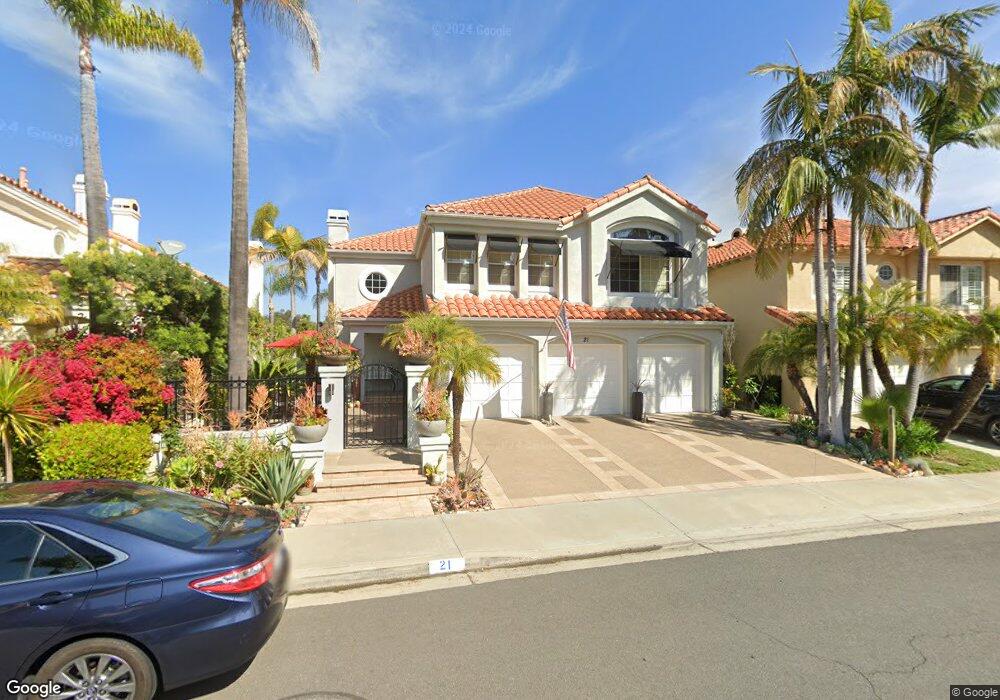
21 Via di Nola Laguna Niguel, CA 92677
Marina Hills NeighborhoodEstimated Value: $1,858,804 - $2,641,000
4
Beds
4
Baths
3,255
Sq Ft
$730/Sq Ft
Est. Value
About This Home
This home is located at 21 Via di Nola, Laguna Niguel, CA 92677 and is currently estimated at $2,376,451, approximately $730 per square foot. 21 Via di Nola is a home located in Orange County with nearby schools including George White Elementary, Niguel Hills Middle School, and Dana Hills High School.
Ownership History
Date
Name
Owned For
Owner Type
Purchase Details
Closed on
Sep 21, 2021
Sold by
Betterly Byron Lee and Betterly Sharan Ann
Bought by
Betterly Byron Lee and Betterly Sharan Ann
Current Estimated Value
Home Financials for this Owner
Home Financials are based on the most recent Mortgage that was taken out on this home.
Original Mortgage
$337,700
Outstanding Balance
$257,768
Interest Rate
2.1%
Mortgage Type
New Conventional
Estimated Equity
$2,118,683
Purchase Details
Closed on
May 5, 2018
Sold by
Betterly Byron Lee and Betterly Sharan Ann
Bought by
Betterly Byron Lee and Betterly Sharan Ann
Purchase Details
Closed on
Mar 5, 2018
Sold by
Betterly Byron Lee and Betterly Sharan Ann
Bought by
Betterly Byron Lee and Betterly Sharan Ann
Home Financials for this Owner
Home Financials are based on the most recent Mortgage that was taken out on this home.
Original Mortgage
$374,000
Interest Rate
4.4%
Mortgage Type
New Conventional
Purchase Details
Closed on
Mar 8, 2016
Sold by
Lincoln Crew Cx
Bought by
Mancini Michael
Home Financials for this Owner
Home Financials are based on the most recent Mortgage that was taken out on this home.
Interest Rate
3.64%
Purchase Details
Closed on
Jun 5, 1998
Sold by
Betterly Bryon Lee and Betterly Sharan Ann
Bought by
Betterly Byron Lee and Betterly Sharan Ann
Home Financials for this Owner
Home Financials are based on the most recent Mortgage that was taken out on this home.
Original Mortgage
$300,000
Interest Rate
7.17%
Purchase Details
Closed on
Apr 25, 1995
Sold by
Betterly Byron L and Betterly Sharan A
Bought by
Betterly Byron Lee and Betterly Sharan Ann
Create a Home Valuation Report for This Property
The Home Valuation Report is an in-depth analysis detailing your home's value as well as a comparison with similar homes in the area
Home Values in the Area
Average Home Value in this Area
Purchase History
| Date | Buyer | Sale Price | Title Company |
|---|---|---|---|
| Betterly Byron Lee | -- | Ticor Title Company Of Ca | |
| Betterly Byron Lee | -- | Ticor Title Company Of Ca | |
| Betterly Byron Lee | -- | Title Source Inc | |
| Betterly Byron Lee | -- | Tsi Title Co | |
| Mancini Michael | -- | -- | |
| Betterly Byron Lee | -- | American Title Co | |
| Betterly Bryon Lee | -- | American Title Co | |
| Betterly Byron Lee | -- | Benefit Land Title Co |
Source: Public Records
Mortgage History
| Date | Status | Borrower | Loan Amount |
|---|---|---|---|
| Open | Betterly Byron Lee | $337,700 | |
| Closed | Betterly Byron Lee | $374,000 | |
| Closed | Mancini Michael | -- | |
| Previous Owner | Betterly Bryon Lee | $300,000 | |
| Closed | Mancini Michael | $0 |
Source: Public Records
Tax History Compared to Growth
Tax History
| Year | Tax Paid | Tax Assessment Tax Assessment Total Assessment is a certain percentage of the fair market value that is determined by local assessors to be the total taxable value of land and additions on the property. | Land | Improvement |
|---|---|---|---|---|
| 2025 | $7,069 | $717,946 | $289,024 | $428,922 |
| 2024 | $7,069 | $703,869 | $283,357 | $420,512 |
| 2023 | $6,918 | $690,068 | $277,801 | $412,267 |
| 2022 | $6,785 | $676,538 | $272,354 | $404,184 |
| 2021 | $6,653 | $663,273 | $267,014 | $396,259 |
| 2020 | $6,586 | $656,472 | $264,276 | $392,196 |
| 2019 | $6,455 | $643,600 | $259,094 | $384,506 |
| 2018 | $6,330 | $630,981 | $254,014 | $376,967 |
| 2017 | $6,205 | $618,609 | $249,033 | $369,576 |
| 2016 | $6,085 | $606,480 | $244,150 | $362,330 |
| 2015 | $5,992 | $597,371 | $240,483 | $356,888 |
| 2014 | $5,876 | $585,670 | $235,772 | $349,898 |
Source: Public Records
Map
Nearby Homes