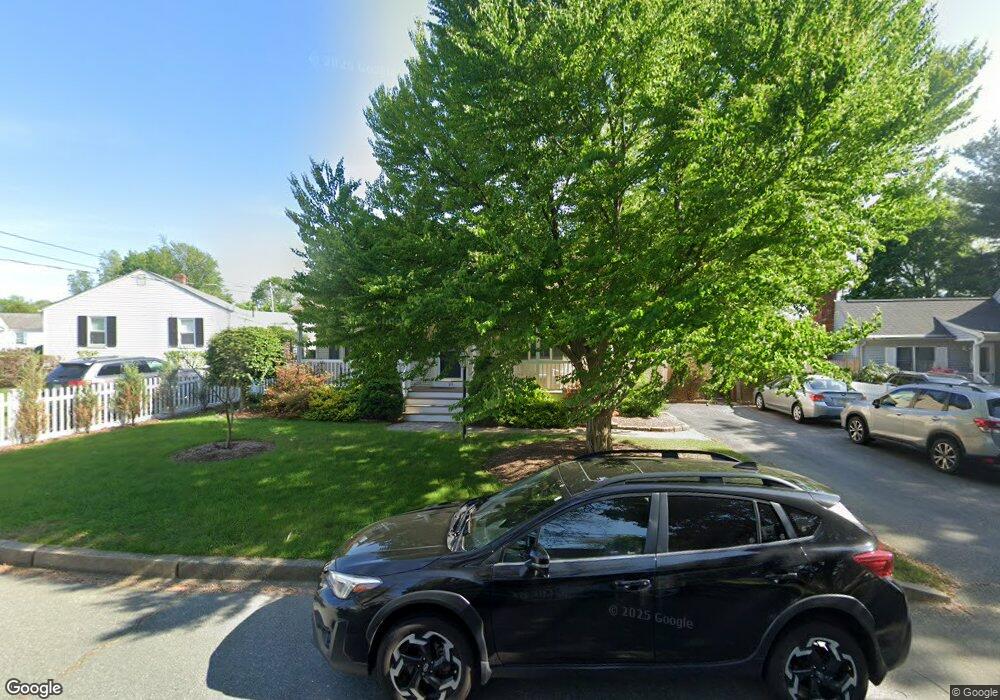
21 W Hill Dr Cranston, RI 02920
Meshanticut NeighborhoodEstimated Value: $434,000 - $457,000
3
Beds
2
Baths
1,508
Sq Ft
$294/Sq Ft
Est. Value
About This Home
This home is located at 21 W Hill Dr, Cranston, RI 02920 and is currently estimated at $443,496, approximately $294 per square foot. 21 W Hill Dr is a home located in Providence County with nearby schools including George J. Peters School, Western Hills Middle School, and Cranston High School West.
Ownership History
Date
Name
Owned For
Owner Type
Purchase Details
Closed on
Mar 24, 1995
Sold by
Peters David G and Peters Noella
Bought by
Simonelli Michael J and Simonelli Leslie
Current Estimated Value
Home Financials for this Owner
Home Financials are based on the most recent Mortgage that was taken out on this home.
Original Mortgage
$40,000
Interest Rate
8.78%
Create a Home Valuation Report for This Property
The Home Valuation Report is an in-depth analysis detailing your home's value as well as a comparison with similar homes in the area
Home Values in the Area
Average Home Value in this Area
Purchase History
| Date | Buyer | Sale Price | Title Company |
|---|---|---|---|
| Simonelli Michael J | $99,000 | -- |
Source: Public Records
Mortgage History
| Date | Status | Borrower | Loan Amount |
|---|---|---|---|
| Open | Simonelli Michael J | $20,110 | |
| Closed | Simonelli Michael J | $40,000 |
Source: Public Records
Tax History Compared to Growth
Tax History
| Year | Tax Paid | Tax Assessment Tax Assessment Total Assessment is a certain percentage of the fair market value that is determined by local assessors to be the total taxable value of land and additions on the property. | Land | Improvement |
|---|---|---|---|---|
| 2025 | $5,123 | $369,100 | $104,600 | $264,500 |
| 2024 | $5,023 | $369,100 | $104,600 | $264,500 |
| 2023 | $4,967 | $262,800 | $72,200 | $190,600 |
| 2022 | $4,864 | $262,800 | $72,200 | $190,600 |
| 2021 | $4,730 | $262,800 | $72,200 | $190,600 |
| 2020 | $4,590 | $221,000 | $75,600 | $145,400 |
| 2019 | $4,590 | $221,000 | $75,600 | $145,400 |
| 2018 | $4,484 | $221,000 | $75,600 | $145,400 |
| 2017 | $3,959 | $172,600 | $61,900 | $110,700 |
| 2016 | $3,875 | $172,600 | $61,900 | $110,700 |
| 2015 | $3,875 | $172,600 | $61,900 | $110,700 |
| 2014 | $3,830 | $167,700 | $61,900 | $105,800 |
Source: Public Records
Map
Nearby Homes