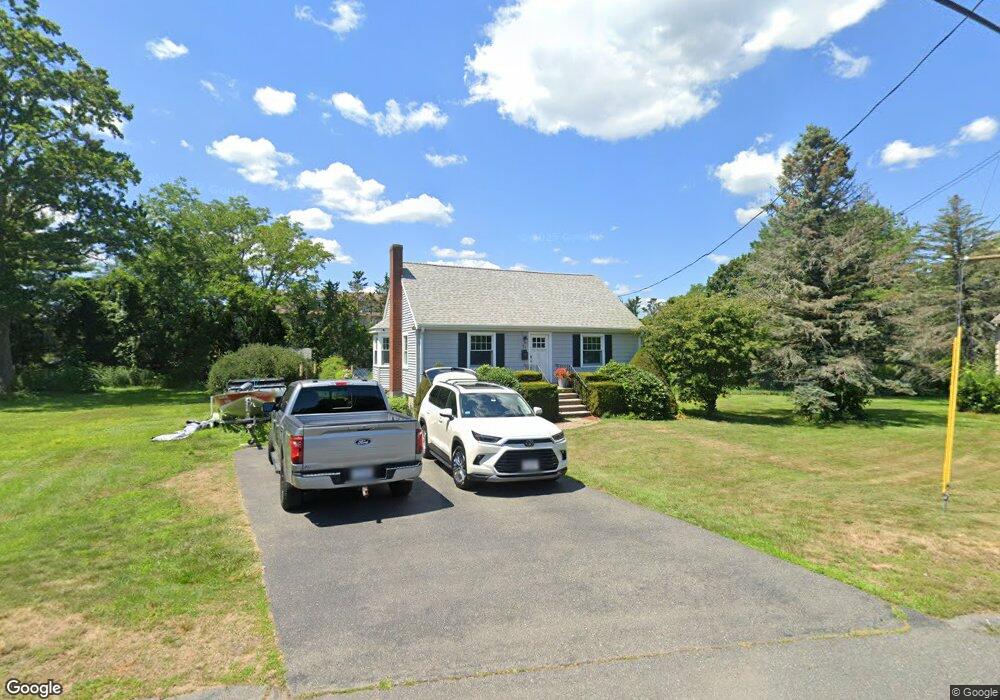
21 Walnut St Danvers, MA 01923
Estimated Value: $636,000 - $721,000
3
Beds
2
Baths
1,399
Sq Ft
$485/Sq Ft
Est. Value
About This Home
This home is located at 21 Walnut St, Danvers, MA 01923 and is currently estimated at $679,119, approximately $485 per square foot. 21 Walnut St is a home located in Essex County with nearby schools including Danvers High School, St. Mary of the Annunciation School, and Plumfield Academy.
Ownership History
Date
Name
Owned For
Owner Type
Purchase Details
Closed on
Aug 15, 2017
Sold by
Carney Loyd J and Carney Patricia L
Bought by
Carney 2017 T and Carney C
Current Estimated Value
Purchase Details
Closed on
Oct 1, 1973
Bought by
Carney Lloyd J and Carney Patricia L
Create a Home Valuation Report for This Property
The Home Valuation Report is an in-depth analysis detailing your home's value as well as a comparison with similar homes in the area
Home Values in the Area
Average Home Value in this Area
Purchase History
| Date | Buyer | Sale Price | Title Company |
|---|---|---|---|
| Carney 2017 T | -- | -- | |
| Carney Lloyd J | -- | -- |
Source: Public Records
Mortgage History
| Date | Status | Borrower | Loan Amount |
|---|---|---|---|
| Previous Owner | Carney Lloyd J | $100,000 | |
| Previous Owner | Carney Lloyd J | $25,000 | |
| Previous Owner | Carney Lloyd J | $82,000 | |
| Previous Owner | Carney Lloyd J | $33,000 |
Source: Public Records
Tax History
| Year | Tax Paid | Tax Assessment Tax Assessment Total Assessment is a certain percentage of the fair market value that is determined by local assessors to be the total taxable value of land and additions on the property. | Land | Improvement |
|---|---|---|---|---|
| 2025 | $6,934 | $630,900 | $384,900 | $246,000 |
| 2024 | $6,930 | $623,800 | $384,900 | $238,900 |
| 2023 | $6,467 | $550,400 | $349,800 | $200,600 |
| 2022 | $6,443 | $508,900 | $317,400 | $191,500 |
| 2021 | $6,237 | $467,200 | $300,600 | $166,600 |
| 2020 | $6,056 | $463,700 | $297,100 | $166,600 |
| 2019 | $5,709 | $429,900 | $270,100 | $159,800 |
| 2018 | $5,583 | $412,300 | $267,400 | $144,900 |
| 2017 | $5,255 | $370,300 | $233,700 | $136,600 |
| 2016 | $5,045 | $355,300 | $222,900 | $132,400 |
| 2015 | $4,893 | $328,200 | $202,600 | $125,600 |
Source: Public Records
Map
Nearby Homes
- 47 Collins St Unit 50
- 10 Clark St
- 18 Wadsworth St
- 103 Newbury St Unit 1
- 22 Braman St
- 98 Newbury St Unit 18B
- 98 Newbury St Unit 23B
- 63 Adams St
- 14 Williams St Unit C17
- 57 Sylvan St Unit 5D
- 97 Sylvan St Unit 7
- 43 Hobart St Unit B
- 9 Ledgewood Way Unit 6
- 8 Ledgewood Way Unit 20
- 261 Newbury St Unit 17A
- 10 Ledgewood Way Unit 26
- 7 Ledgewood Way Unit 8
- 22 Maple Ave
- 3 Ledgewood Way Unit 8
- 286 Newbury St Unit 110
Your Personal Tour Guide
Ask me questions while you tour the home.