Estimated Value: $347,000 - $371,000
3
Beds
3
Baths
1,360
Sq Ft
$266/Sq Ft
Est. Value
About This Home
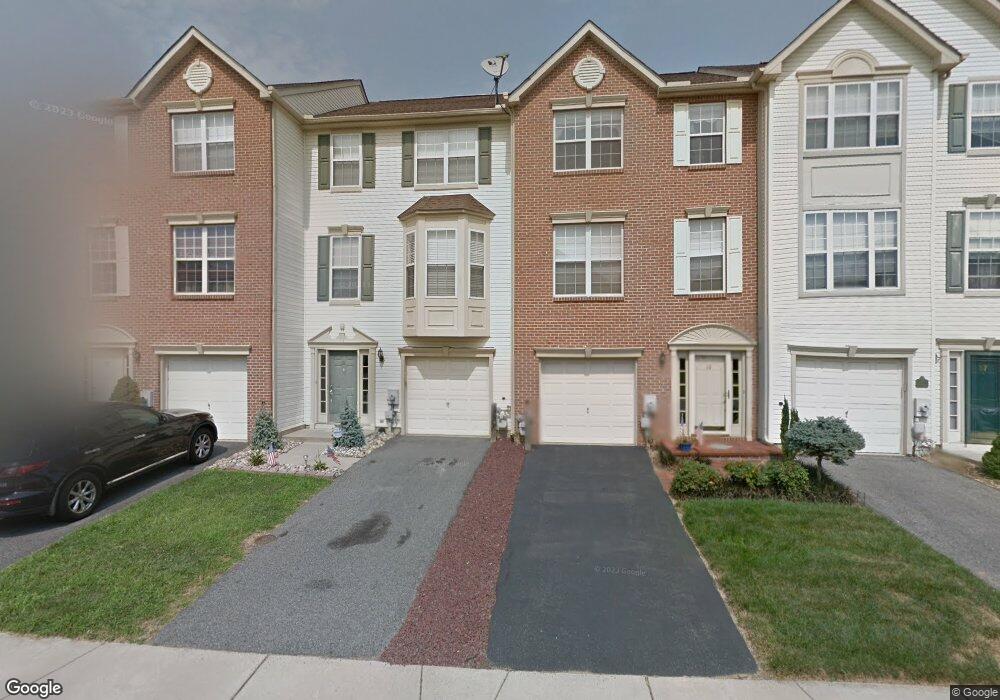
This home is located at 21 Wicklow Rd, Bear, DE 19701 and is currently estimated at $361,518, approximately $265 per square foot. 21 Wicklow Rd is a home located in New Castle County with nearby schools including Olive B. Loss Elementary School, Alfred G. Waters Middle School, and Appoquinimink High School.
Ownership History
Date
Name
Owned For
Owner Type
Purchase Details
Closed on
Jun 23, 2021
Sold by
Windley Thomas C and Thomas C Windley Revocable Tru
Bought by
Ford Mark George
Current Estimated Value
Home Financials for this Owner
Home Financials are based on the most recent Mortgage that was taken out on this home.
Original Mortgage
$13,746
Outstanding Balance
$12,495
Interest Rate
3.02%
Mortgage Type
New Conventional
Estimated Equity
$349,023
Purchase Details
Closed on
Nov 16, 2009
Sold by
Windley Thomas C
Bought by
Windley Thomas C and Thomas C Windley Revocable Tru
Purchase Details
Closed on
Jul 12, 2002
Sold by
Windley Thomas C and Carlyle Windley E
Bought by
Windley Thomas C
Home Financials for this Owner
Home Financials are based on the most recent Mortgage that was taken out on this home.
Original Mortgage
$135,000
Interest Rate
5.87%
Create a Home Valuation Report for This Property
The Home Valuation Report is an in-depth analysis detailing your home's value as well as a comparison with similar homes in the area
Home Values in the Area
Average Home Value in this Area
Purchase History
| Date | Buyer | Sale Price | Title Company |
|---|---|---|---|
| Ford Mark George | $280,000 | None Available | |
| Windley Thomas C | -- | None Available | |
| Windley Thomas C | -- | -- |
Source: Public Records
Mortgage History
| Date | Status | Borrower | Loan Amount |
|---|---|---|---|
| Open | Ford Mark George | $13,746 | |
| Open | Ford Mark George | $274,928 | |
| Previous Owner | Windley Thomas C | $135,000 |
Source: Public Records
Tax History
| Year | Tax Paid | Tax Assessment Tax Assessment Total Assessment is a certain percentage of the fair market value that is determined by local assessors to be the total taxable value of land and additions on the property. | Land | Improvement |
|---|---|---|---|---|
| 2024 | $2,385 | $54,900 | $7,500 | $47,400 |
| 2023 | $2,041 | $54,900 | $7,500 | $47,400 |
| 2022 | $2,044 | $54,900 | $7,500 | $47,400 |
| 2021 | $2,018 | $54,900 | $7,500 | $47,400 |
| 2020 | $1,991 | $54,900 | $7,500 | $47,400 |
| 2019 | $2,144 | $54,900 | $7,500 | $47,400 |
| 2018 | $264 | $54,900 | $7,500 | $47,400 |
| 2017 | $1,564 | $54,900 | $7,500 | $47,400 |
| 2016 | $1,564 | $54,900 | $7,500 | $47,400 |
| 2015 | $1,524 | $54,900 | $7,500 | $47,400 |
| 2014 | $1,523 | $54,900 | $7,500 | $47,400 |
Source: Public Records
Map
Nearby Homes
- 25 Shawn Ln
- 34 Brittany Ln
- 1 Jasmine Dr
- 1 Bohemia Rd
- 4 Riva Ridge Ln
- 103 Sarah Cir
- 2 Pegasus Place
- 15 Eaton Place
- 7 Keeneland Ct
- 301 E Furrow Ln
- 52 Eaton Place
- 61 Rose Hill Dr
- 2956 Frazer Rd
- 48 Marble House Dr
- 258 Dillon Cir
- 321 Jessica Dr
- 251 Dillon Cir
- 9 Hempstead Dr
- 557 Mansion House Rd
- 32 Chancellorsville Cir
Your Personal Tour Guide
Ask me questions while you tour the home.