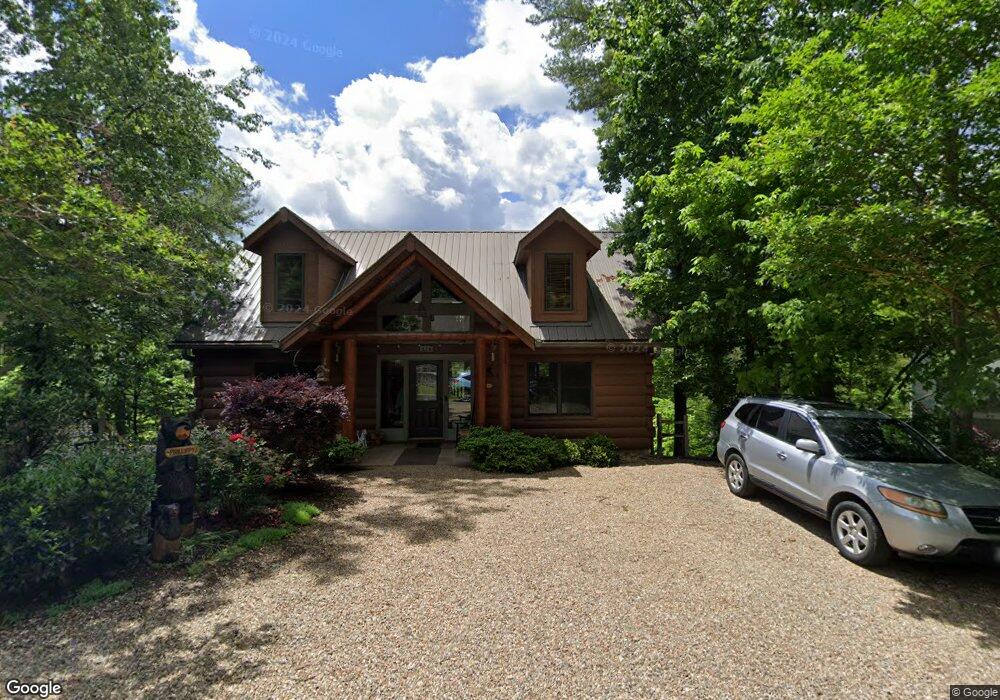
210 Ace Gap Rd Townsend, TN 37882
Estimated Value: $527,521 - $725,000
About This Home
This home is located at 210 Ace Gap Rd, Townsend, TN 37882 and is currently estimated at $611,380, approximately $292 per square foot. 210 Ace Gap Rd is a home located in Blount County with nearby schools including Townsend Elementary School, Heritage Middle School, and Heritage High School.
Ownership History
We collect this data history from publicly available records. To have your information removed, we recommend requesting removal directly through your county’s website.
Purchase Details
Home Financials for this Owner
Home Financials are based on the most recent Mortgage that was taken out on this home.Purchase Details
Purchase Details
Purchase Details
Purchase Details
Purchase Details
Purchase Details
Home Values in the Area
Average Home Value in this Area
Purchase History
We collect this data history from publicly available records. To have your information removed, we recommend requesting removal directly through your county’s website.
| Date | Buyer | Sale Price | Title Company |
|---|---|---|---|
| $217,500 | -- | ||
| $295,000 | -- | ||
| $32,500 | -- | ||
| -- | -- | ||
| -- | -- | ||
| -- | -- | ||
| -- | -- |
Mortgage History
We collect this data history from publicly available records. To have your information removed, we recommend requesting removal directly through your county’s website.
| Date | Status | Borrower | Loan Amount |
|---|---|---|---|
| Open | $174,000 |
Tax History
We collect this data history from publicly available records. To have your information removed, we recommend requesting removal directly through your county’s website.
| Year | Tax Paid | Tax Assessment Tax Assessment Total Assessment is a certain percentage of the fair market value that is determined by local assessors to be the total taxable value of land and additions on the property. | Land | Improvement |
|---|---|---|---|---|
| 2025 | $1,593 | $100,200 | $15,000 | $85,200 |
| 2024 | $1,593 | $100,200 | $15,000 | $85,200 |
| 2023 | $1,593 | $100,200 | $15,000 | $85,200 |
| 2022 | $1,629 | $65,950 | $10,075 | $55,875 |
| 2021 | $1,629 | $65,950 | $10,075 | $55,875 |
| 2020 | $1,629 | $65,950 | $10,075 | $55,875 |
| 2019 | $1,629 | $65,950 | $10,075 | $55,875 |
| 2018 | $1,672 | $67,675 | $10,325 | $57,350 |
| 2017 | $1,672 | $67,675 | $10,325 | $57,350 |
| 2016 | $1,672 | $67,675 | $10,325 | $57,350 |
| 2015 | $1,455 | $67,675 | $10,325 | $57,350 |
| 2014 | $1,576 | $67,675 | $10,325 | $57,350 |
| 2013 | $1,576 | $73,300 | $0 | $0 |
Map
- 0 Ace Gap Rd Unit 1325220
- 218 Ace Gap Rd
- 207 Cutter Gap Rd
- 407 Kurts Corner Rd
- 129 Cutter Gap Rd
- 210 Cutter Gap Rd
- 123 Cutter Gap Rd
- 126 Cutter Gap Rd
- 724 Tanasi Trail
- 124 Cutter Gap Rd
- 716 Tanasi Trail
- 231 Low Gap Trail
- 114 Cutter Gap Rd
- 438 Kurts Corner Rd
- 147 Tolliver Trail
- 228 Tolliver Trail
- 236 Tolliver Trail
- 1005 Laurel Rd
- 544 Nathans Nook Rd
- 00 Laurel Rd
- 212 Ace Gap Rd
- 206 Ace Gap Rd
- 209 Ace Gap Rd
- 205 Ace Gap Rd
- 211 Ace Gap Rd
- 0 Ace Gap Rd Unit 1300925
- 0 Ace Gap Rd Unit 595296
- 0 Ace Gap Rd Unit 637688
- 0 Ace Gap Rd Unit 686522
- 0 Ace Gap Rd Unit 704947
- 0 Ace Gap Rd Unit 735057
- 0 Ace Gap Rd Unit 778424
- 0 Ace Gap Rd Unit 1109784
- 0 Ace Gap Rd Unit 1030093
- 0 Ace Gap Rd Unit 1022425
- 0 Ace Gap Rd Unit 12 990566
- 0 Ace Gap Rd
- 215 Ace Gap Rd
- 861 Laurel Rd
- 224 Penni Ln
Ask me questions while you tour the home.