
Seller's Agent in 2025
Tammie Duck
ABW Edmond Inc (BO)
(903) 440-5477
13 in this area
17 Total Sales
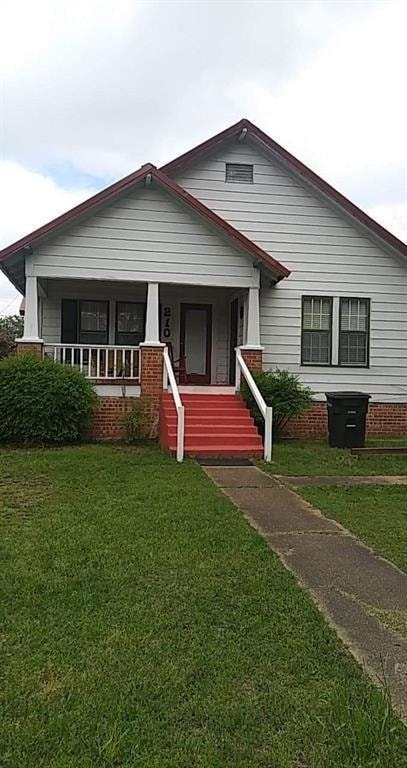


Charming 3-bedroom, 1-bath home located within walking distance of historic downtown Broken Bow. This property features a spacious fenced backyard, perfect for outdoor activities or pets. Inside, the home offers a functional layout with comfortable living spaces and natural light. Conveniently situated just minutes from Broken Bow Lake and Beavers Bend State Park, this home provides easy access to shopping, dining, and outdoor recreation. Ideal as a primary residence, investment, or vacation retreat.
| Date | Type | Sale Price | Title Company |
|---|---|---|---|
| Warranty Deed | $95,000 | Southern Abstract & Title | |
| Warranty Deed | $97,000 | Southern Abstract And Ttl Co | |
| Warranty Deed | $65,000 | None Available | |
| Sheriffs Deed | -- | -- | |
| Warranty Deed | $45,000 | -- |
| Date | Status | Loan Amount | Loan Type |
|---|---|---|---|
| Previous Owner | $87,300 | New Conventional | |
| Previous Owner | $52,819 | Future Advance Clause Open End Mortgage |
| Date | Event | Price | List to Sale | Price per Sq Ft |
|---|---|---|---|---|
| 11/11/2025 11/11/25 | Sold | $100,000 | -13.0% | $86 / Sq Ft |
| 10/20/2025 10/20/25 | Pending | -- | -- | -- |
| 09/20/2025 09/20/25 | For Sale | $115,000 | -- | $99 / Sq Ft |
| Year | Tax Paid | Tax Assessment Tax Assessment Total Assessment is a certain percentage of the fair market value that is determined by local assessors to be the total taxable value of land and additions on the property. | Land | Improvement |
|---|---|---|---|---|
| 2025 | $256 | $3,077 | $450 | $2,627 |
| 2024 | $244 | $2,931 | $429 | $2,502 |
| 2023 | $240 | $2,931 | $429 | $2,502 |
| 2022 | $875 | $10,670 | $429 | $10,241 |
| 2021 | $440 | $5,457 | $429 | $5,028 |
| 2020 | $459 | $5,650 | $429 | $5,221 |
| 2019 | $469 | $5,747 | $429 | $5,318 |
| 2018 | $482 | $5,844 | $429 | $5,415 |
| 2017 | $502 | $6,037 | $429 | $5,608 |
| 2016 | $515 | $6,144 | $429 | $5,715 |
| 2015 | $527 | $6,144 | $429 | $5,715 |
| 2014 | $531 | $6,144 | $429 | $5,715 |
Seller's Agent in 2025
Tammie Duck
ABW Edmond Inc (BO)
(903) 440-5477
13 in this area
17 Total Sales
Source: MLSOK
MLS Number: 1192560
APN: 2001-00-020-007-0-000-00
Disclaimer: Certain information contained herein is derived from information provided by parties other than Homes.com. All information provided is deemed reliable, but is not guaranteed to be accurate and should be independently verified.
![]() IDX information is provided exclusively for personal, non-commercial use, and may not be used for any purpose other than to identify prospective properties consumers may be interested in purchasing.
IDX information is provided exclusively for personal, non-commercial use, and may not be used for any purpose other than to identify prospective properties consumers may be interested in purchasing.
Information is deemed reliable but not guaranteed.
This information is not verified for authenticity or accuracy, is not guaranteed and may not reflect all real estate activity in the market.
Copyright 2026 MLSOK, Inc. All rights reserved.
Ask me questions while you tour the home.