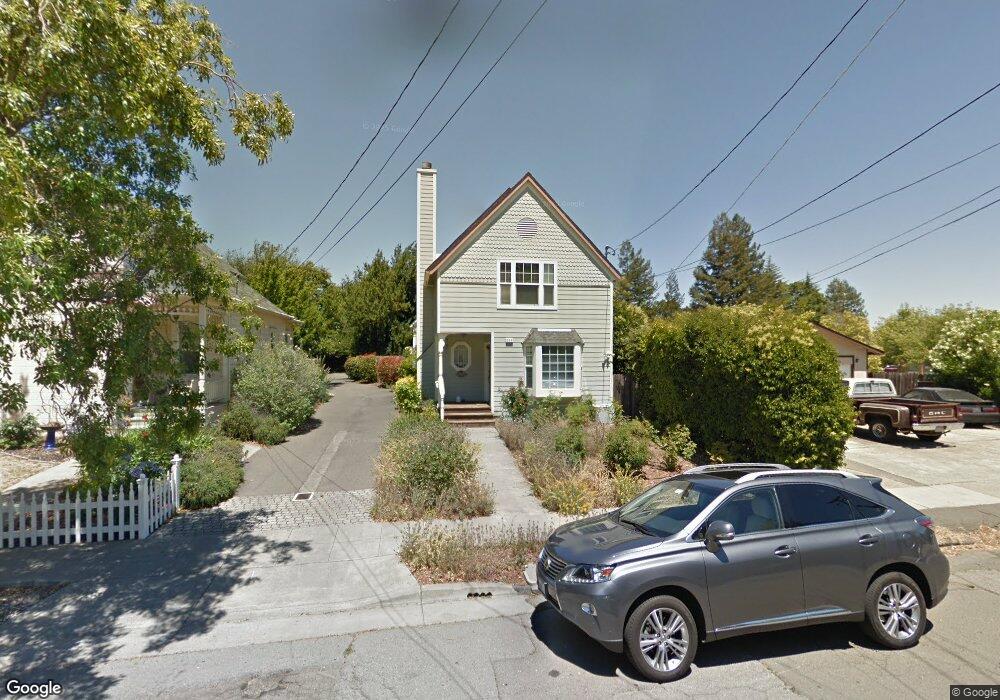
210 Baker St Petaluma, CA 94952
Western Petaluma NeighborhoodEstimated Value: $1,088,000 - $1,306,000
3
Beds
4
Baths
1,602
Sq Ft
$730/Sq Ft
Est. Value
About This Home
This home is located at 210 Baker St, Petaluma, CA 94952 and is currently estimated at $1,169,986, approximately $730 per square foot. 210 Baker St is a home located in Sonoma County with nearby schools including Valley Vista Elementary School, Petaluma Junior High School, and Petaluma High School.
Ownership History
Date
Name
Owned For
Owner Type
Purchase Details
Closed on
Feb 15, 2022
Sold by
Vasanti Jayaswal
Bought by
Vasabtu Jayaswal Revocable Living Trust
Current Estimated Value
Purchase Details
Closed on
Dec 23, 2009
Sold by
Jwi Investment Corporation
Bought by
Jayaswal Vasanti
Home Financials for this Owner
Home Financials are based on the most recent Mortgage that was taken out on this home.
Original Mortgage
$311,500
Interest Rate
4.88%
Mortgage Type
New Conventional
Purchase Details
Closed on
Jan 21, 2004
Sold by
Barletta Marilyn Marlene
Bought by
J W I Investment Corp
Purchase Details
Closed on
May 9, 1996
Sold by
Premo Georgine D and Premo Eugene M
Bought by
Barletta Marilyn M
Home Financials for this Owner
Home Financials are based on the most recent Mortgage that was taken out on this home.
Original Mortgage
$175,000
Interest Rate
7.8%
Create a Home Valuation Report for This Property
The Home Valuation Report is an in-depth analysis detailing your home's value as well as a comparison with similar homes in the area
Home Values in the Area
Average Home Value in this Area
Purchase History
| Date | Buyer | Sale Price | Title Company |
|---|---|---|---|
| Vasabtu Jayaswal Revocable Living Trust | -- | None Listed On Document | |
| Jayaswal Vasanti | $536,500 | Old Republic Title Company | |
| J W I Investment Corp | $36,100 | -- | |
| Barletta Marilyn M | $250,000 | Old Republic Title Company |
Source: Public Records
Mortgage History
| Date | Status | Borrower | Loan Amount |
|---|---|---|---|
| Previous Owner | Jayaswal Vasanti | $311,500 | |
| Previous Owner | Barletta Marilyn M | $175,000 |
Source: Public Records
Tax History
| Year | Tax Paid | Tax Assessment Tax Assessment Total Assessment is a certain percentage of the fair market value that is determined by local assessors to be the total taxable value of land and additions on the property. | Land | Improvement |
|---|---|---|---|---|
| 2025 | $7,434 | $692,512 | $227,178 | $465,334 |
| 2024 | $7,434 | $678,934 | $222,724 | $456,210 |
| 2023 | $7,434 | $665,622 | $218,357 | $447,265 |
| 2022 | $7,195 | $652,572 | $214,076 | $438,496 |
| 2021 | $7,059 | $639,778 | $209,879 | $429,899 |
| 2020 | $7,119 | $633,218 | $207,727 | $425,491 |
| 2019 | $7,030 | $620,803 | $203,654 | $417,149 |
| 2018 | $7,002 | $608,631 | $199,661 | $408,970 |
| 2017 | $6,854 | $596,698 | $195,747 | $400,951 |
| 2016 | $6,692 | $584,999 | $191,909 | $393,090 |
| 2015 | $6,598 | $576,213 | $189,027 | $387,186 |
| 2014 | $6,564 | $564,927 | $185,325 | $379,602 |
Source: Public Records
Map
Nearby Homes
- 301 Broadway St
- 136 Court St
- 131 Liberty St
- 712 Oak Terrace
- 100 Orchard Ln
- 852 Western Ave
- 12 Haven Dr
- 1309 D Street Extension
- 331 Keller St Unit 6
- 519 7th St
- 510 Kent St
- 426 1st St
- 518 Galland St
- 512 Kentucky St
- 611 Petaluma Blvd S
- 13 Dorenfeld Ct
- 12 Dorenfeld Ct
- 809 Gilardi Dr
- 720 Petaluma Blvd S Unit 28
- 21 Branching Way
Your Personal Tour Guide
Ask me questions while you tour the home.