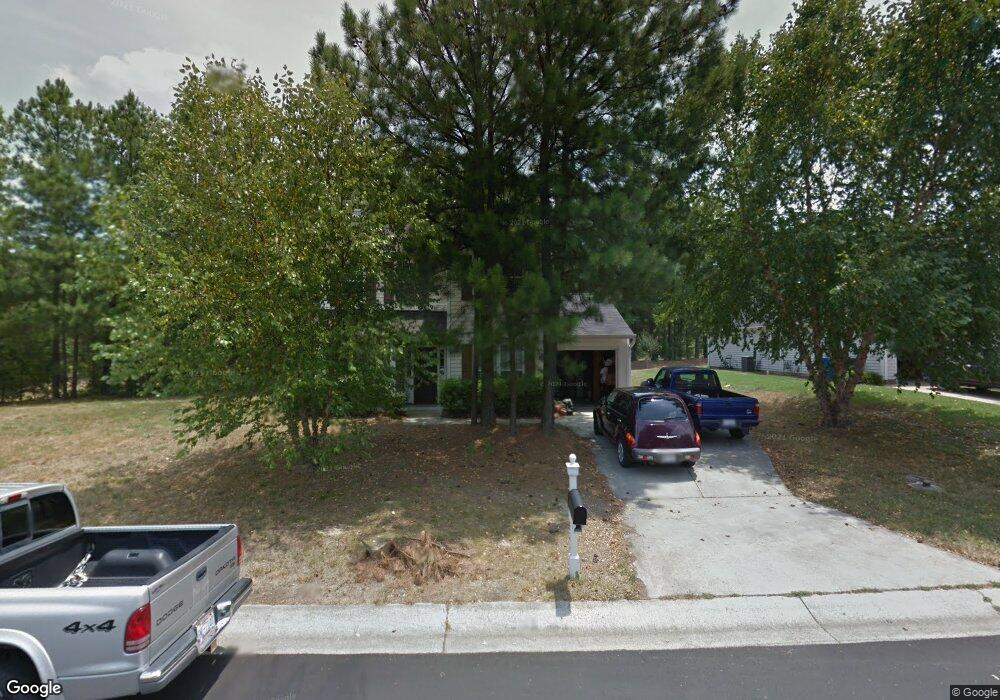
210 Briarhaven Dr Durham, NC 27703
Eastern Durham NeighborhoodEstimated Value: $302,000 - $353,000
3
Beds
3
Baths
1,423
Sq Ft
$238/Sq Ft
Est. Value
About This Home
This home is located at 210 Briarhaven Dr, Durham, NC 27703 and is currently estimated at $338,483, approximately $237 per square foot. 210 Briarhaven Dr is a home located in Durham County with nearby schools including Oak Grove Elementary, John W Neal Middle School, and Southern School of Energy & Sustainability.
Ownership History
Date
Name
Owned For
Owner Type
Purchase Details
Closed on
Jun 15, 2012
Sold by
Ergle Kevin Dennis
Bought by
Silk Wayne D and Silk Patsy A
Current Estimated Value
Home Financials for this Owner
Home Financials are based on the most recent Mortgage that was taken out on this home.
Original Mortgage
$95,200
Outstanding Balance
$62,116
Interest Rate
2.62%
Mortgage Type
Adjustable Rate Mortgage/ARM
Estimated Equity
$276,367
Purchase Details
Closed on
Apr 4, 2008
Sold by
Wells Fargo Bank Na
Bought by
Hud
Purchase Details
Closed on
Nov 22, 2006
Sold by
Truitt Humphrey and Truitt Jacqueline Phillips
Bought by
Wells Fargo Bank Na
Purchase Details
Closed on
Nov 18, 1999
Sold by
D R Horton Inc Torrey
Bought by
Truitt Humphrey and Truitt Jacqueline Phillips
Home Financials for this Owner
Home Financials are based on the most recent Mortgage that was taken out on this home.
Original Mortgage
$130,950
Interest Rate
7.81%
Mortgage Type
FHA
Create a Home Valuation Report for This Property
The Home Valuation Report is an in-depth analysis detailing your home's value as well as a comparison with similar homes in the area
Home Values in the Area
Average Home Value in this Area
Purchase History
| Date | Buyer | Sale Price | Title Company |
|---|---|---|---|
| Silk Wayne D | $119,000 | None Available | |
| Hud | -- | None Available | |
| Wells Fargo Bank Na | $139,619 | None Available | |
| Truitt Humphrey | $132,000 | -- |
Source: Public Records
Mortgage History
| Date | Status | Borrower | Loan Amount |
|---|---|---|---|
| Open | Silk Wayne D | $95,200 | |
| Previous Owner | Truitt Humphrey | $130,950 |
Source: Public Records
Tax History Compared to Growth
Tax History
| Year | Tax Paid | Tax Assessment Tax Assessment Total Assessment is a certain percentage of the fair market value that is determined by local assessors to be the total taxable value of land and additions on the property. | Land | Improvement |
|---|---|---|---|---|
| 2025 | $3,199 | $322,700 | $89,250 | $233,450 |
| 2024 | $2,490 | $178,525 | $44,737 | $133,788 |
| 2023 | $2,339 | $178,525 | $44,737 | $133,788 |
| 2022 | $2,285 | $178,525 | $44,737 | $133,788 |
| 2021 | $2,274 | $178,525 | $44,737 | $133,788 |
| 2020 | $2,221 | $178,525 | $44,737 | $133,788 |
| 2019 | $2,221 | $178,525 | $44,737 | $133,788 |
| 2018 | $2,005 | $147,826 | $32,807 | $115,019 |
| 2017 | $1,990 | $147,826 | $32,807 | $115,019 |
| 2016 | $1,923 | $147,826 | $32,807 | $115,019 |
| 2015 | $2,103 | $151,924 | $28,715 | $123,209 |
| 2014 | $2,103 | $151,924 | $28,715 | $123,209 |
Source: Public Records
Map
Nearby Homes
- 210 Stallings Rd
- 1 Thorn Brook Ct
- 2800-2809 Napoli Dr
- 4 Fire Rock Place
- 406 Robbins Rd
- 402 Robbins Rd
- 103 Bermuda Green Dr
- 5255 Wake Forest Rd
- 1130 Arbor Edge Ln
- 204 Hillview Dr
- 5609 Thistlerock Ln
- 106 Newberry Ln
- 208 Lick Creek Ln
- 110 Kindlewood Dr
- 4 N Berrymeadow Ln
- 10 Autrey Mill Cir
- 2 Red Sage Ct
- 5409 Hadrian Dr
- 620 Conover Rd
- 613 Ashburn Ln
- 206 Briarhaven Dr
- 204 Briarhaven Dr
- 205 Briarhaven Dr
- 211 Briarhaven Dr
- 203 Briarhaven Dr
- 202 Briarhaven Dr
- 213 Briarhaven Dr
- 212 Briarhaven Dr
- 201 Briarhaven Dr
- 312 Stallings Rd
- 312 Stallings Rd Unit 4
- 3 Cayman Ct
- 110 Willowbrook Dr
- 304 Stallings Rd
- 304 Stallings Rd Unit 2
- 320 Stallings Rd
- 320 Stallings Rd Unit 1
- 320 Stallings Rd Unit 6
- 316 Stallings Rd
- 5 Cayman Ct