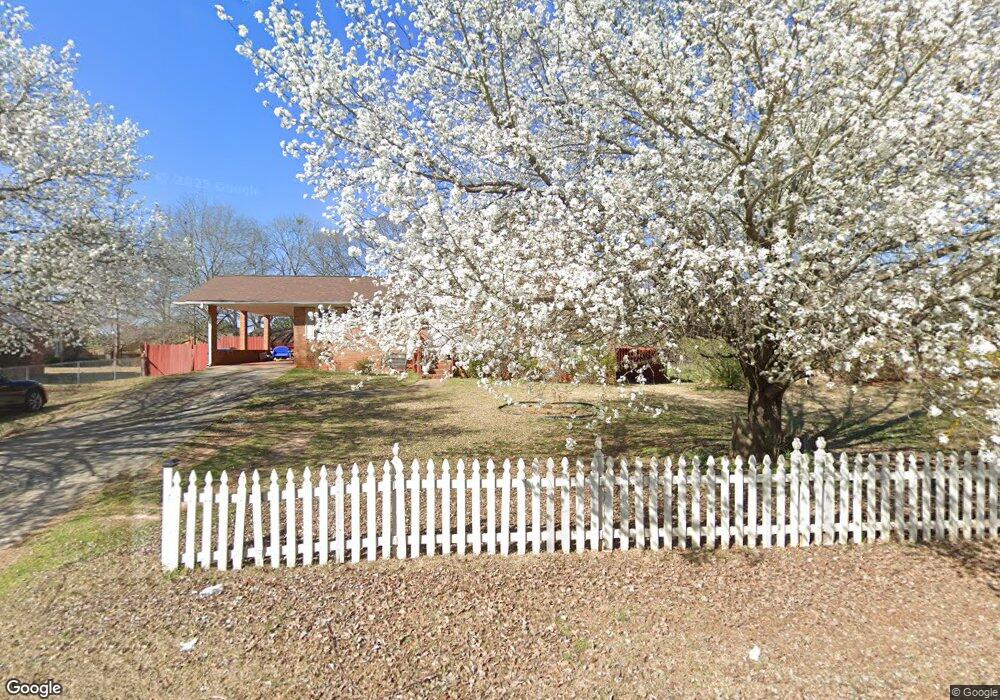
210 Cabriolet Trail McDonough, GA 30253
Estimated Value: $215,000 - $238,892
4
Beds
2
Baths
1,706
Sq Ft
$135/Sq Ft
Est. Value
About This Home
This home is located at 210 Cabriolet Trail, McDonough, GA 30253 and is currently estimated at $230,223, approximately $134 per square foot. 210 Cabriolet Trail is a home located in Henry County with nearby schools including Walnut Creek Elementary School, McDonough Middle School, and McDonough Methodist Academy.
Ownership History
Date
Name
Owned For
Owner Type
Purchase Details
Closed on
Mar 16, 2021
Sold by
Le Dung Quoc
Bought by
Wesselink Larry Curtis
Current Estimated Value
Purchase Details
Closed on
May 14, 2010
Sold by
Hud-Housing Of Urban Dev
Bought by
Le Dung Q
Purchase Details
Closed on
Sep 1, 2009
Sold by
Wells Fargo Bk Na
Bought by
Hud-Housing Of Urban Dev
Purchase Details
Closed on
Jul 25, 2001
Sold by
Brady Charles E
Bought by
Hemphill Kevin C and Hemphill Stephanie
Home Financials for this Owner
Home Financials are based on the most recent Mortgage that was taken out on this home.
Original Mortgage
$110,073
Interest Rate
7.19%
Mortgage Type
FHA
Purchase Details
Closed on
Apr 15, 1997
Sold by
Landis David J and Landis Daphne M
Bought by
Brady Charles E
Home Financials for this Owner
Home Financials are based on the most recent Mortgage that was taken out on this home.
Original Mortgage
$86,700
Interest Rate
7.98%
Mortgage Type
VA
Create a Home Valuation Report for This Property
The Home Valuation Report is an in-depth analysis detailing your home's value as well as a comparison with similar homes in the area
Home Values in the Area
Average Home Value in this Area
Purchase History
| Date | Buyer | Sale Price | Title Company |
|---|---|---|---|
| Wesselink Larry Curtis | $154,000 | -- | |
| Le Dung Q | -- | -- | |
| Hud-Housing Of Urban Dev | -- | -- | |
| Wells Fargo Bk Na | $111,780 | -- | |
| Hemphill Kevin C | $111,500 | -- | |
| Brady Charles E | $85,000 | -- |
Source: Public Records
Mortgage History
| Date | Status | Borrower | Loan Amount |
|---|---|---|---|
| Previous Owner | Hemphill Kevin C | $110,073 | |
| Previous Owner | Brady Charles E | $86,700 |
Source: Public Records
Tax History Compared to Growth
Tax History
| Year | Tax Paid | Tax Assessment Tax Assessment Total Assessment is a certain percentage of the fair market value that is determined by local assessors to be the total taxable value of land and additions on the property. | Land | Improvement |
|---|---|---|---|---|
| 2025 | $3,502 | $93,720 | $10,000 | $83,720 |
| 2024 | $3,502 | $93,720 | $10,000 | $83,720 |
| 2023 | $2,999 | $93,720 | $10,000 | $83,720 |
| 2022 | $2,378 | $61,600 | $8,378 | $53,222 |
| 2021 | $1,507 | $45,400 | $10,000 | $35,400 |
| 2020 | $1,465 | $43,560 | $10,000 | $33,560 |
| 2019 | $1,368 | $39,160 | $10,000 | $29,160 |
| 2018 | $1,289 | $37,080 | $8,000 | $29,080 |
| 2016 | $1,107 | $32,160 | $6,000 | $26,160 |
| 2015 | $826 | $24,680 | $6,000 | $18,680 |
| 2014 | $708 | $22,200 | $6,000 | $16,200 |
Source: Public Records
Map
Nearby Homes
- 1244 Faye Ct
- 360 Atlanta St
- 204 Rankin Cir
- 90 Cabriolet Trail
- 7030 Kingston Ln
- 271 Spring Creek Blvd
- 615 Chase Ln
- 0 Ivey Edwards Ln Unit 10409448
- 0 Ivey Edwards Ln Unit 10246400
- 7011 Regency Ln
- 7000 Regency Ln
- 4170 Monarch Dr
- 117 Tracy Ln
- 386 Waterfront Dr
- 409 Hyder Ct
- 20 Rosebud Ln
- 365 Oakpark Terrace
- 351 Hamilton Pointe Dr
- 646 Autumn Leaf Cir
- 65 Carmichael St
- 200 Cabriolet Trail
- 220 Cabriolet Trail
- 481 Atlanta St
- 190 Cabriolet Trail
- 221 Cabriolet Trail
- 201 Cabriolet Trail
- 191 Cabriolet Trail
- 180 Cabriolet Trail
- 380 Rankin Cir
- 384 Rankin Cir
- 376 Rankin Cir
- 388 Rankin Cir
- 392 Rankin Cir
- 451 Highway 42 N
- 181 Cabriolet Trail
- 396 Rankin Cir
- 170 Cabriolet Trail
- 372 Rankin Cir Unit 17
- 372 Rankin Cir
- 400 Rankin Cir