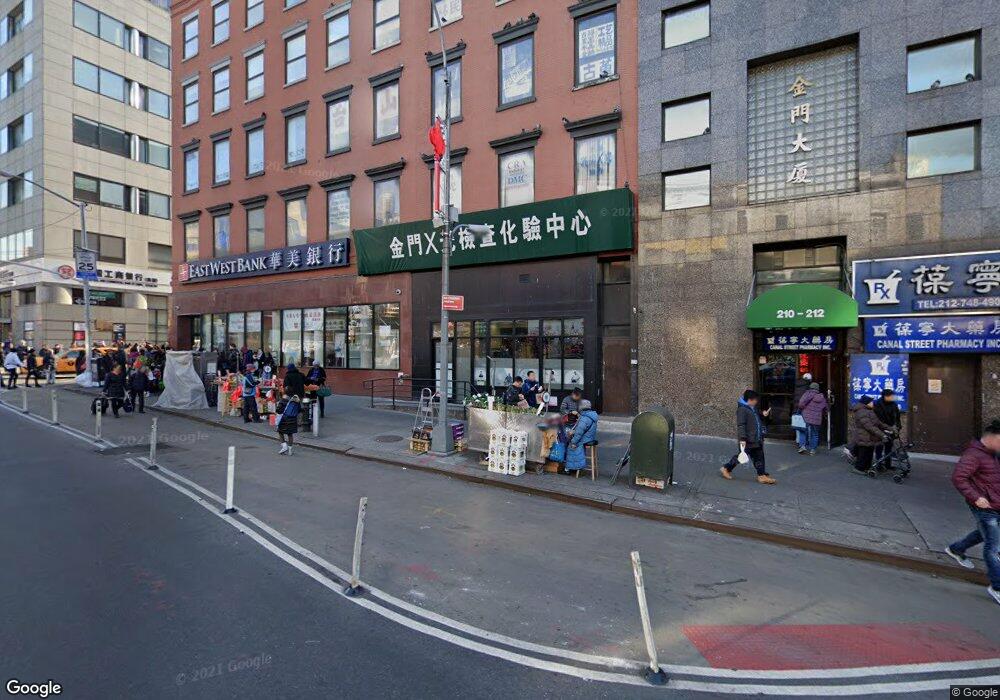
210 Canal St Unit 311 New York, NY 10013
Chinatown NeighborhoodEstimated Value: $240,927
--
Bed
--
Bath
274
Sq Ft
$879/Sq Ft
Est. Value
About This Home
This home is located at 210 Canal St Unit 311, New York, NY 10013 and is currently estimated at $240,927, approximately $879 per square foot. 210 Canal St Unit 311 is a home located in New York County with nearby schools including P.S. 124 Yung Wing Elementary, M.S. 131 Dr. Sun Yat Sen, and Lower Manhattan Community Middle School.
Ownership History
Date
Name
Owned For
Owner Type
Purchase Details
Closed on
Dec 13, 2012
Sold by
210 Canal Street Realty Llc
Bought by
Jesslanb Holdings Llc
Current Estimated Value
Create a Home Valuation Report for This Property
The Home Valuation Report is an in-depth analysis detailing your home's value as well as a comparison with similar homes in the area
Home Values in the Area
Average Home Value in this Area
Purchase History
| Date | Buyer | Sale Price | Title Company |
|---|---|---|---|
| Jesslanb Holdings Llc | $184,758 | -- |
Source: Public Records
Tax History Compared to Growth
Tax History
| Year | Tax Paid | Tax Assessment Tax Assessment Total Assessment is a certain percentage of the fair market value that is determined by local assessors to be the total taxable value of land and additions on the property. | Land | Improvement |
|---|---|---|---|---|
| 2025 | $2,979 | $27,650 | $8,996 | $18,654 |
| 2024 | $2,979 | $28,127 | $8,996 | $19,131 |
| 2023 | $2,957 | $27,777 | $8,996 | $18,781 |
| 2022 | $2,786 | $25,908 | $8,996 | $16,912 |
| 2021 | $2,507 | $23,442 | $8,996 | $14,446 |
| 2020 | $2,950 | $33,482 | $8,996 | $24,486 |
| 2019 | $2,677 | $28,106 | $8,996 | $19,110 |
| 2018 | $2,706 | $28,005 | $8,996 | $19,009 |
| 2017 | $2,305 | $25,619 | $8,997 | $16,622 |
| 2016 | $2,155 | $24,757 | $8,997 | $15,760 |
| 2015 | $1,324 | $20,825 | $8,997 | $11,828 |
| 2014 | $1,324 | $19,983 | $8,997 | $10,986 |
Source: Public Records
Map
Nearby Homes
- 210 Canal St Unit 510
- 123 Baxter St Unit PHB
- 53 Elizabeth St Unit 4-A
- 133 Mulberry St Unit 4C
- 50 Bayard St Unit 2R
- 50 Bayard St Unit 2J
- 50 Bayard St Unit 4L
- 50 Bayard St Unit 7W
- 50 Bayard St Unit 6T
- 50 Bayard St Unit 8W
- 129 Lafayette St Unit 8C
- 185 Grand St Unit 6 C
- 185 Grand St Unit 2B
- 83 Walker St Unit 4
- 83 Walker St Unit 5
- 50 Franklin St Unit 7A
- 274 Canal St
- 395 Broadway Unit 7E
- 395 Broadway Unit 4E
- 6 Chatham Square
- 210 Canal St Unit 508/509
- 210 Canal St Unit 602
- 210 Canal St Unit 305
- 210 Canal St Unit 607
- 210 Canal St Unit 609
- 210 Canal St Unit 306
- 210 Canal St Unit 611
- 210 Canal St Unit 411
- 210 Canal St Unit 601
- 210 Canal St Unit 310
- 210 Canal St Unit 610
- 210 Canal St Unit 502
- 210 Canal St Unit 203
- 210 Canal St Unit STOR1
- 210 Canal St Unit 312
- 210 Canal St Unit 204
- 210 Canal St Unit 303
- 210 Canal St Unit 604
- 210 Canal St Unit 308
- 210 Canal St Unit 404