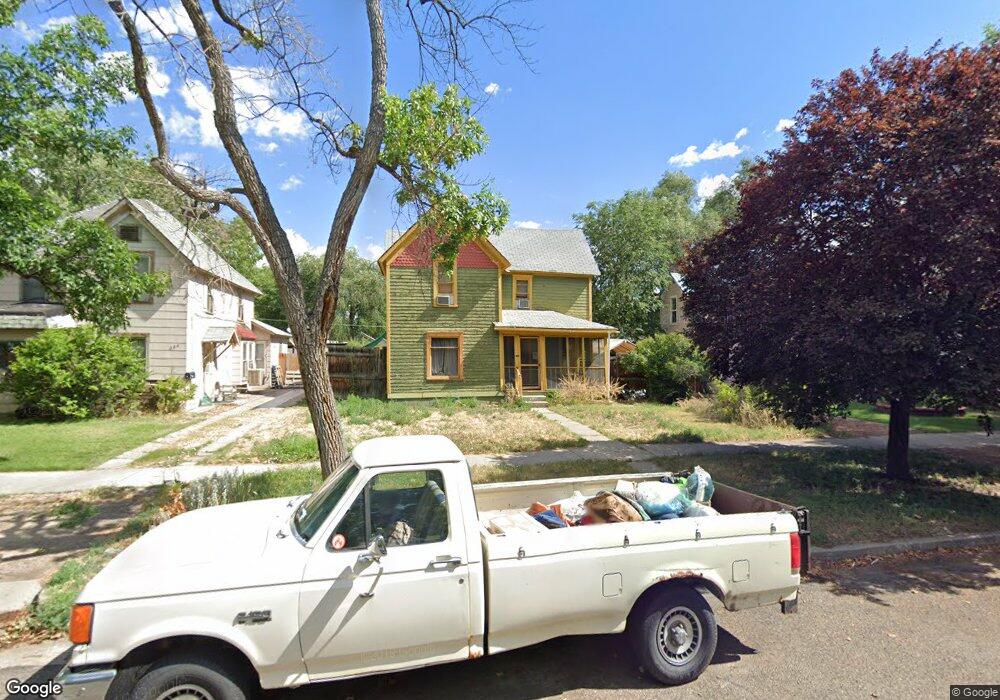
210 Chipeta Ave Grand Junction, CO 81501
Downtown Grand Junction NeighborhoodEstimated Value: $354,000 - $421,000
3
Beds
2
Baths
1,408
Sq Ft
$274/Sq Ft
Est. Value
About This Home
This home is located at 210 Chipeta Ave, Grand Junction, CO 81501 and is currently estimated at $385,612, approximately $273 per square foot. 210 Chipeta Ave is a home located in Mesa County with nearby schools including Chipeta Elementary School, West Middle School, and Grand Junction High School.
Ownership History
Date
Name
Owned For
Owner Type
Purchase Details
Closed on
May 18, 2020
Sold by
Miller David R
Bought by
Miller David R and Kelleher Janet Margaret
Current Estimated Value
Home Financials for this Owner
Home Financials are based on the most recent Mortgage that was taken out on this home.
Original Mortgage
$183,300
Outstanding Balance
$162,429
Interest Rate
3.3%
Mortgage Type
New Conventional
Estimated Equity
$223,183
Purchase Details
Closed on
Feb 3, 2011
Sold by
Daly Miller Shari L
Bought by
Miller David R
Purchase Details
Closed on
Jul 30, 1993
Sold by
Roskos Mark D
Bought by
Miller David R
Home Financials for this Owner
Home Financials are based on the most recent Mortgage that was taken out on this home.
Original Mortgage
$69,010
Interest Rate
7.37%
Mortgage Type
FHA
Purchase Details
Closed on
Sep 11, 1992
Sold by
Hansen Jeffrey D
Bought by
Miller David R
Create a Home Valuation Report for This Property
The Home Valuation Report is an in-depth analysis detailing your home's value as well as a comparison with similar homes in the area
Home Values in the Area
Average Home Value in this Area
Purchase History
| Date | Buyer | Sale Price | Title Company |
|---|---|---|---|
| Miller David R | -- | Land Title Guarantee Co | |
| Miller David R | -- | None Available | |
| Miller David R | $68,700 | -- | |
| Miller David R | $68,700 | None Listed On Document | |
| Miller David R | $55,000 | -- |
Source: Public Records
Mortgage History
| Date | Status | Borrower | Loan Amount |
|---|---|---|---|
| Open | Miller David R | $183,300 | |
| Closed | Miller David R | $69,010 |
Source: Public Records
Tax History
| Year | Tax Paid | Tax Assessment Tax Assessment Total Assessment is a certain percentage of the fair market value that is determined by local assessors to be the total taxable value of land and additions on the property. | Land | Improvement |
|---|---|---|---|---|
| 2024 | $1,258 | $17,800 | $4,720 | $13,080 |
| 2023 | $1,258 | $17,800 | $4,720 | $13,080 |
| 2022 | $1,127 | $15,640 | $4,170 | $11,470 |
| 2021 | $1,131 | $16,090 | $4,290 | $11,800 |
| 2020 | $843 | $12,270 | $3,580 | $8,690 |
| 2019 | $797 | $12,270 | $3,580 | $8,690 |
| 2018 | $835 | $11,800 | $3,240 | $8,560 |
| 2017 | $832 | $11,800 | $3,240 | $8,560 |
| 2016 | $741 | $11,820 | $3,380 | $8,440 |
Source: Public Records
Map
Nearby Homes
- 236 Gunnison Ave
- 729 N 3rd St
- 242 Teller Ave
- 302 W Grand Ave
- 1015 N 4th St
- 346 Main St Unit 201
- 805 N 7th St
- 815 N 7th St
- 604 N 7th St
- 125 Franklin Ave Unit 505D
- 125 Franklin Ave Unit 407
- 125 Franklin Ave Unit 509
- 520 N 7th St
- 631 Belford Ave
- 260 Ute Ave
- 2550 American Way
- 735 Teller Ave
- 181 Elm Ave
- 850 Hill Ave
- 1502 E Sherwood Dr
- 220 Chipeta Ave
- 226 Chipeta Ave
- 215 Chipeta Ave
- 232 Chipeta Ave
- 203 Chipeta Ave
- 221 Chipeta Ave
- 227 Chipeta Ave
- 140 Chipeta Ave
- 244 Chipeta Ave
- 215 Gunnison Ave
- 233 Chipeta Ave
- 621 N 2nd St
- 587 N 2nd St
- 134 Chipeta Ave
- 203 Gunnison Ave
- 219 Gunnison Ave
- 533 N 2nd St
- 248 Chipeta Ave
- 225 Gunnison Ave
- 241 Chipeta Ave
Your Personal Tour Guide
Ask me questions while you tour the home.