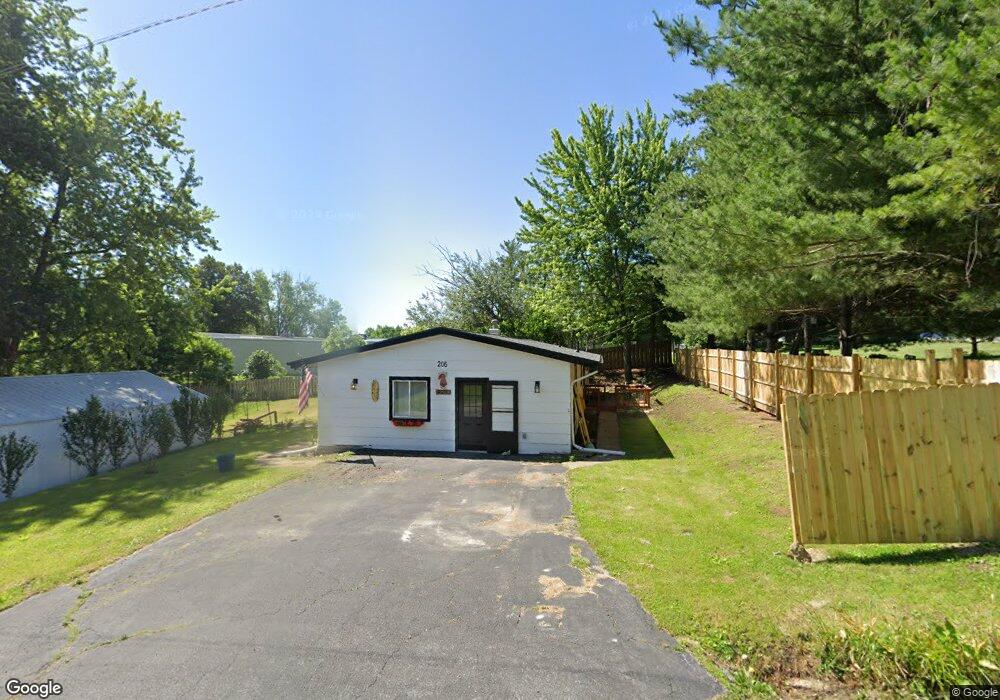
210 E Edwards St Payson, IL 62360
Estimated Value: $166,000 - $179,000
3
Beds
1
Bath
1,465
Sq Ft
$118/Sq Ft
Est. Value
About This Home
This home is located at 210 E Edwards St, Payson, IL 62360 and is currently estimated at $173,027, approximately $118 per square foot. 210 E Edwards St is a home located in Adams County with nearby schools including Seymour Elementary School and Seymour High School.
Ownership History
Date
Name
Owned For
Owner Type
Purchase Details
Closed on
Jun 13, 2023
Sold by
Norris Michael and Norris Misty
Bought by
Hall Thomas E
Current Estimated Value
Home Financials for this Owner
Home Financials are based on the most recent Mortgage that was taken out on this home.
Original Mortgage
$160,000
Outstanding Balance
$155,759
Interest Rate
7.25%
Mortgage Type
VA
Estimated Equity
$17,268
Purchase Details
Closed on
Jun 14, 2022
Sold by
Jeremy Tipton
Bought by
Norris Michael and Norris Misty
Home Financials for this Owner
Home Financials are based on the most recent Mortgage that was taken out on this home.
Original Mortgage
$100,000
Interest Rate
4.75%
Mortgage Type
New Conventional
Purchase Details
Closed on
Apr 25, 2022
Sold by
Neese William H
Bought by
Tipton Jeremy
Home Financials for this Owner
Home Financials are based on the most recent Mortgage that was taken out on this home.
Original Mortgage
$100,000
Interest Rate
4.75%
Mortgage Type
New Conventional
Purchase Details
Closed on
Apr 20, 2021
Sold by
Neese Dawn K
Bought by
Neese William H
Create a Home Valuation Report for This Property
The Home Valuation Report is an in-depth analysis detailing your home's value as well as a comparison with similar homes in the area
Purchase History
| Date | Buyer | Sale Price | Title Company |
|---|---|---|---|
| Hall Thomas E | $160,000 | Title Center | |
| Norris Michael | $78,000 | Title Center | |
| Tipton Jeremy | $66,000 | Title Center | |
| Neese William H | -- | -- |
Source: Public Records
Mortgage History
| Date | Status | Borrower | Loan Amount |
|---|---|---|---|
| Open | Hall Thomas E | $160,000 | |
| Previous Owner | Norris Michael | $100,000 | |
| Previous Owner | Tipton Jeremy | $56,100 |
Source: Public Records
Tax History
| Year | Tax Paid | Tax Assessment Tax Assessment Total Assessment is a certain percentage of the fair market value that is determined by local assessors to be the total taxable value of land and additions on the property. | Land | Improvement |
|---|---|---|---|---|
| 2024 | $883 | $53,330 | $5,370 | $47,960 |
| 2023 | $883 | $26,000 | $6,630 | $19,370 |
| 2022 | $1,609 | $28,990 | $6,300 | $22,690 |
| 2021 | $1,578 | $28,160 | $6,120 | $22,040 |
| 2020 | $1,541 | $27,420 | $5,960 | $21,460 |
| 2019 | $1,488 | $26,460 | $5,750 | $20,710 |
| 2018 | $1,436 | $25,690 | $5,580 | $20,110 |
| 2017 | $1,393 | $24,940 | $5,420 | $19,520 |
| 2016 | $1,458 | $23,370 | $5,080 | $18,290 |
| 2015 | $1,270,460 | $23,370 | $5,080 | $18,290 |
| 2012 | $1,188 | $22,770 | $4,950 | $17,820 |
Source: Public Records
Map
Nearby Homes
- 104 W Edwards St
- 107 N Fulton St
- 409 N Main St
- .031 ac m/l Angle St
- SE Cor Lot 15
- 4823 Bitter Rd
- 4611 Barbara Jane Ct
- 4616 Barbara Jane Ct
- 4605 Barbara Jane Ct
- 4604 Barbara Jane Ct
- 4610 Barbara Jane Ct
- 4617 Oakwood Dr
- 4601 Oakwood Dr
- 4523 Oakwood Dr
- SE Sec 21 1 244 A
- SE Sec 21 2s8w 3 139
- 4006 Halfpap Ln
- 1019 Burton Meadows Rd
- 1433 Hemingway
- 3430 Timberline Dr
- 206 E Edwards St
- 209 & 211 E Edwards St
- 205 E Edwards St
- 208 E Edwards St
- 116 N Park St
- 207 E Edwards St
- 203 E Edwards St
- 108 N Park St
- 212 E Edwards St
- 201 E Edwards St
- 205 E State St
- 211 E Edwards St
- 105 E Edwards St
- 302 E Edwards St
- 301 E State St
- 301 E Edwards St
- 304 E Edwards St
- 303 E State St
- 204 E State St
- 306 E Edwards St
Your Personal Tour Guide
Ask me questions while you tour the home.