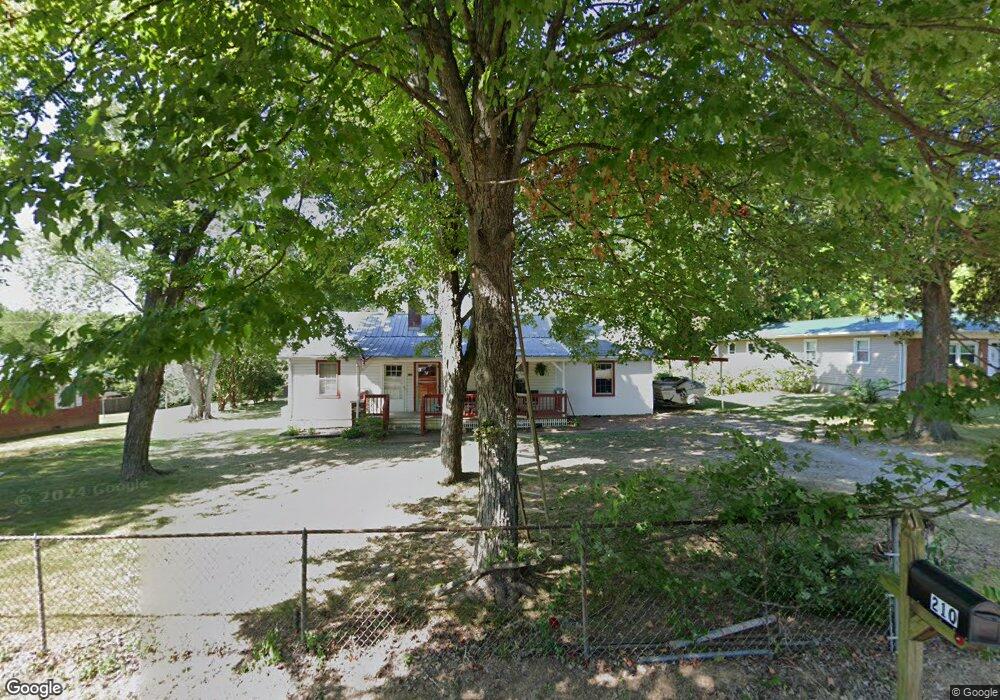
210 Fairview Ln Clarksville, TN 37040
Estimated Value: $194,000 - $224,000
--
Bed
1
Bath
1,236
Sq Ft
$169/Sq Ft
Est. Value
About This Home
This home is located at 210 Fairview Ln, Clarksville, TN 37040 and is currently estimated at $208,548, approximately $168 per square foot. 210 Fairview Ln is a home located in Montgomery County with nearby schools including St. Bethlehem Elementary School, Burt Elementary School, and Kenwood Middle School.
Ownership History
Date
Name
Owned For
Owner Type
Purchase Details
Closed on
Apr 26, 2024
Sold by
Schwab Denise and Mccormick Diane
Bought by
Webb Shane
Current Estimated Value
Home Financials for this Owner
Home Financials are based on the most recent Mortgage that was taken out on this home.
Original Mortgage
$186,558
Outstanding Balance
$184,566
Interest Rate
6.74%
Mortgage Type
FHA
Estimated Equity
$23,982
Purchase Details
Closed on
Mar 8, 2024
Sold by
Schwab Denise and Mccormick Diane
Bought by
Schwab Denise and Mccormick Diane
Home Financials for this Owner
Home Financials are based on the most recent Mortgage that was taken out on this home.
Original Mortgage
$186,558
Outstanding Balance
$184,566
Interest Rate
6.74%
Mortgage Type
FHA
Estimated Equity
$23,982
Purchase Details
Closed on
Apr 27, 2020
Sold by
Wooten Thomas Vernon and Wooten Susan Denise
Bought by
Schwab Denise and Mccormick Diane
Purchase Details
Closed on
Apr 18, 2020
Sold by
Schwab Denise and Estate Of Annette Wooten
Bought by
Wootens Annette and Schwab Denise
Create a Home Valuation Report for This Property
The Home Valuation Report is an in-depth analysis detailing your home's value as well as a comparison with similar homes in the area
Home Values in the Area
Average Home Value in this Area
Purchase History
| Date | Buyer | Sale Price | Title Company |
|---|---|---|---|
| Webb Shane | $190,000 | Foreman Watson Land Title | |
| Schwab Denise | -- | Foreman Watson Land Title | |
| Schwab Denise | $17,100 | None Available | |
| Wootens Annette | -- | None Available |
Source: Public Records
Mortgage History
| Date | Status | Borrower | Loan Amount |
|---|---|---|---|
| Open | Webb Shane | $186,558 |
Source: Public Records
Tax History Compared to Growth
Tax History
| Year | Tax Paid | Tax Assessment Tax Assessment Total Assessment is a certain percentage of the fair market value that is determined by local assessors to be the total taxable value of land and additions on the property. | Land | Improvement |
|---|---|---|---|---|
| 2024 | $1,270 | $42,600 | $0 | $0 |
| 2023 | $1,270 | $21,400 | $0 | $0 |
| 2022 | $903 | $21,400 | $0 | $0 |
| 2021 | $903 | $21,400 | $0 | $0 |
| 2020 | $860 | $21,400 | $0 | $0 |
| 2019 | $860 | $21,400 | $0 | $0 |
| 2018 | $684 | $11,500 | $0 | $0 |
| 2017 | $197 | $15,850 | $0 | $0 |
| 2016 | $487 | $15,850 | $0 | $0 |
| 2015 | $471 | $15,850 | $0 | $0 |
| 2014 | $659 | $15,850 | $0 | $0 |
| 2013 | $658 | $15,975 | $0 | $0 |
Source: Public Records
Map
Nearby Homes
- 226 Fairview Ln
- 15 Bond St
- 6 Welch St
- 24 Garth Dr
- 7 Garth Dr
- 2142 Old Russellville Pike
- 2175 Old Russellville Pike
- 2141 Sanders Rd
- The Belvoir Plan at Walker Townhomes
- The Arista Plan at Walker Townhomes
- 319-1/2 Welchwood Dr
- 2308 Pea Ridge Rd
- 2363 Pea Ridge Rd
- 2365 Pea Ridge Rd
- 2373 Pea Ridge Rd
- 2377 Pea Ridge Rd
- 2375 Pea Ridge Rd
- 2379 Pea Ridge Rd
- 2381 Pea Ridge Rd
- 2383 Pea Ridge Rd
- 200 Fairview Ln
- 220 Fairview Ln Unit B
- 220 Fairview Ln
- 1 Fairview Ln
- 224 Fairview Ln
- 226 Fairview Ln Unit 20
- 190 Fairview Ln
- 187 Fairview Ln
- 189 Fairview Ln
- 191 Fairview Ln
- 230 Fairview Ln
- 193 Fairview Ln
- 175 Fairview Ln
- 195 Fairview Ln
- 165 Fairview Ln
- 185 Fairview Ln
- 180 Fairview Ln
- 165 W Rossview Rd
- 150 Fairview Ln
- 155 Fairview Ln