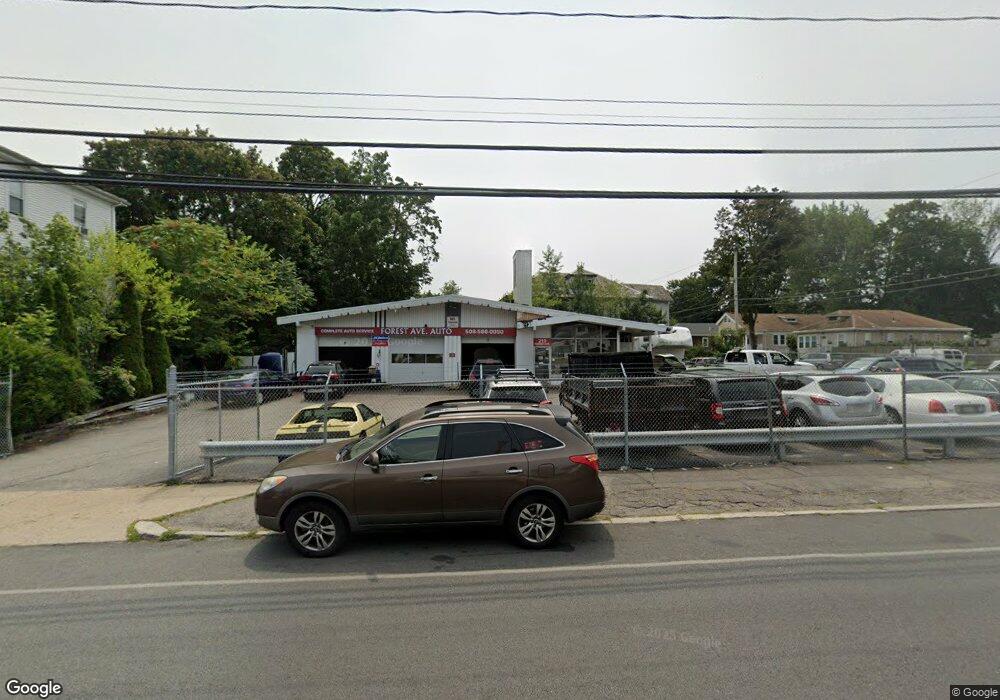
210 Forest Ave Brockton, MA 02301
Clifton Heights NeighborhoodEstimated Value: $788,344
6
Beds
3
Baths
2,148
Sq Ft
$367/Sq Ft
Est. Value
About This Home
This home is located at 210 Forest Ave, Brockton, MA 02301 and is currently priced at $788,344, approximately $367 per square foot. 210 Forest Ave is a home located in Plymouth County with nearby schools including Gilmore Elementary School, John F. Kennedy Elementary School, and Davis K-8 School.
Ownership History
Date
Name
Owned For
Owner Type
Purchase Details
Closed on
May 23, 1996
Sold by
Shell Oil Co
Bought by
Velissaris George
Current Estimated Value
Home Financials for this Owner
Home Financials are based on the most recent Mortgage that was taken out on this home.
Original Mortgage
$70,000
Outstanding Balance
$3,992
Interest Rate
8.01%
Mortgage Type
Commercial
Purchase Details
Closed on
Mar 31, 1989
Sold by
Middleton Frank J
Bought by
Shell Oil Co
Create a Home Valuation Report for This Property
The Home Valuation Report is an in-depth analysis detailing your home's value as well as a comparison with similar homes in the area
Home Values in the Area
Average Home Value in this Area
Purchase History
| Date | Buyer | Sale Price | Title Company |
|---|---|---|---|
| Velissaris George | $60,000 | -- | |
| Shell Oil Co | $50,000 | -- |
Source: Public Records
Mortgage History
| Date | Status | Borrower | Loan Amount |
|---|---|---|---|
| Open | Shell Oil Co | $70,000 |
Source: Public Records
Tax History
| Year | Tax Paid | Tax Assessment Tax Assessment Total Assessment is a certain percentage of the fair market value that is determined by local assessors to be the total taxable value of land and additions on the property. | Land | Improvement |
|---|---|---|---|---|
| 2025 | $8,126 | $335,800 | $194,300 | $141,500 |
| 2024 | $8,076 | $335,800 | $176,600 | $159,200 |
| 2023 | $6,992 | $268,700 | $153,200 | $115,500 |
| 2022 | $6,865 | $243,600 | $153,200 | $90,400 |
| 2021 | $6,888 | $232,400 | $145,900 | $86,500 |
| 2020 | $5,760 | $232,400 | $139,000 | $93,400 |
| 2019 | $7,037 | $222,200 | $139,000 | $83,200 |
| 2018 | $5,225 | $217,500 | $139,000 | $78,500 |
| 2017 | $7,013 | $212,900 | $139,000 | $73,900 |
| 2016 | $6,647 | $207,600 | $138,990 | $68,610 |
| 2015 | $7,033 | $207,600 | $138,990 | $68,610 |
| 2014 | $7,050 | $207,600 | $138,990 | $68,610 |
Source: Public Records
Map
Nearby Homes
- 200 Forest Ave
- 10 Tripp Ave
- 201 Florence St
- 220 Forest Ave
- 59 Forest Rd
- 187 Florence St
- 11 Tripp Ave
- 58 Forest Rd
- 192 Forest Ave
- 192 Forest Ave Unit 2
- 199 Forest Ave
- 15 Tripp Ave
- 24 Tripp Ave
- 219 Forest Ave
- 197 Forest Ave
- 19 Tripp Ave
- 53 Forest Rd
- 193 Forest Ave
- 195 Forest Ave Unit 2
- 193 Forest Ave Unit 1
Your Personal Tour Guide
Ask me questions while you tour the home.