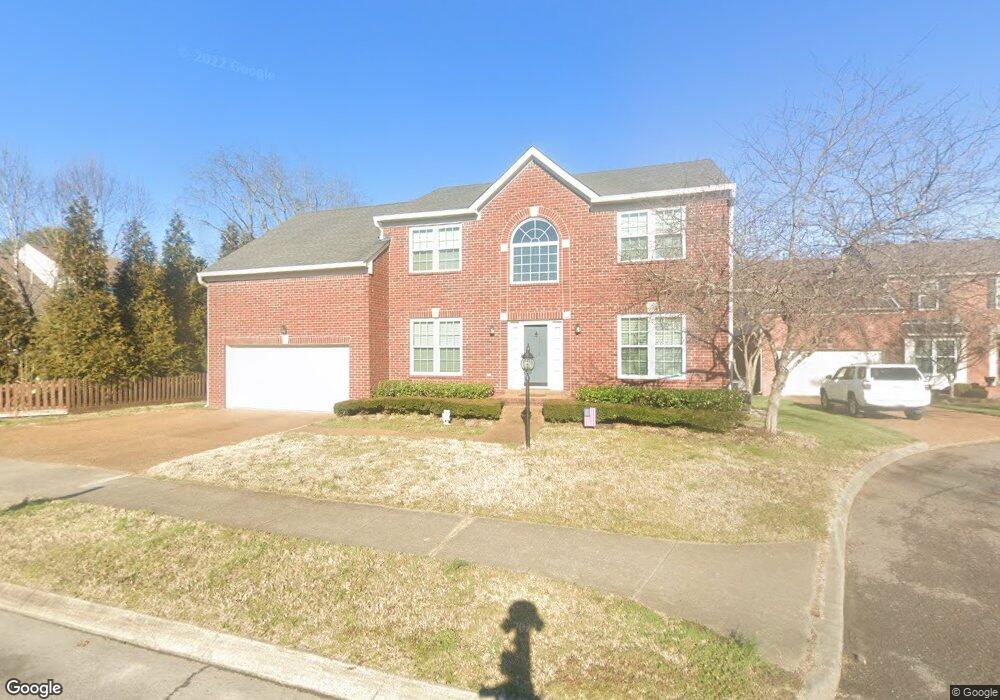
210 Founders Pointe Blvd Franklin, TN 37064
West Franklin NeighborhoodEstimated Value: $693,630 - $774,000
Studio
3
Baths
2,414
Sq Ft
$306/Sq Ft
Est. Value
About This Home
This home is located at 210 Founders Pointe Blvd, Franklin, TN 37064 and is currently estimated at $738,658, approximately $305 per square foot. 210 Founders Pointe Blvd is a home located in Williamson County with nearby schools including Walnut Grove Elementary School, Grassland Middle School, and Franklin High School.
Ownership History
Date
Name
Owned For
Owner Type
Purchase Details
Closed on
Apr 4, 2023
Sold by
Williamson Julius Dwayne
Bought by
Williamson Julius Kelly
Current Estimated Value
Purchase Details
Closed on
Jan 6, 2003
Sold by
Prudential Relocation Inc
Bought by
Williamson Julius Dwayne and Williamson Julie Kelly
Home Financials for this Owner
Home Financials are based on the most recent Mortgage that was taken out on this home.
Original Mortgage
$220,755
Interest Rate
5.98%
Mortgage Type
FHA
Purchase Details
Closed on
Dec 23, 2002
Sold by
Waters Thomas W and Waters Diane S
Bought by
Prudential Relocation Inc
Home Financials for this Owner
Home Financials are based on the most recent Mortgage that was taken out on this home.
Original Mortgage
$220,755
Interest Rate
5.98%
Mortgage Type
FHA
Purchase Details
Closed on
Jul 25, 1996
Sold by
Zaring Homes Inc
Bought by
Waters Thomas W
Create a Home Valuation Report for This Property
The Home Valuation Report is an in-depth analysis detailing your home's value as well as a comparison with similar homes in the area
Home Values in the Area
Average Home Value in this Area
Purchase History
| Date | Buyer | Sale Price | Title Company |
|---|---|---|---|
| Williamson Julius Kelly | -- | -- | |
| Williamson Julius Dwayne | $222,500 | -- | |
| Prudential Relocation Inc | $222,500 | -- | |
| Waters Thomas W | $185,945 | -- |
Source: Public Records
Mortgage History
| Date | Status | Borrower | Loan Amount |
|---|---|---|---|
| Previous Owner | Williamson Julius Dwayne | $220,755 | |
| Previous Owner | Prudential Relocation Inc | $220,755 |
Source: Public Records
Tax History
| Year | Tax Paid | Tax Assessment Tax Assessment Total Assessment is a certain percentage of the fair market value that is determined by local assessors to be the total taxable value of land and additions on the property. | Land | Improvement |
|---|---|---|---|---|
| 2025 | $2,349 | $183,350 | $68,750 | $114,600 |
| 2024 | $2,349 | $108,975 | $28,750 | $80,225 |
| 2023 | $2,349 | $108,975 | $28,750 | $80,225 |
| 2022 | $2,349 | $108,975 | $28,750 | $80,225 |
| 2021 | $2,349 | $108,975 | $28,750 | $80,225 |
| 2020 | $2,168 | $84,125 | $22,500 | $61,625 |
| 2019 | $2,168 | $84,125 | $22,500 | $61,625 |
| 2018 | $2,109 | $84,125 | $22,500 | $61,625 |
| 2017 | $2,092 | $84,125 | $22,500 | $61,625 |
| 2016 | $2,067 | $84,125 | $22,500 | $61,625 |
Source: Public Records
Map
Nearby Homes
- 325 Devonshire Dr
- 207 Lancelot Ln
- 401 Founders Pointe Blvd
- 712 Meeting St
- 3115 Vera Valley Rd
- 215 Wrennewood Ln
- 105 Clapham St
- 5029 Owenruth Dr
- 1632 Cooper Creek Ln
- 1200 Vintage Grove Ln
- 262 Wrennewood Ln
- 532 Bancroft Way
- 518 Antebellum Ct
- 1627 Cooper Creek Ln
- 5003 Rizer Point Dr
- 5037 Owenruth Dr
- 4072 Penfield Dr
- 4064 Penfield Dr
- 3126 Annfield Way
- 3015 Blossom Trail Ln
- 208 Founders Pointe Blvd
- 200 Lancelot Ln
- 202 Lancelot Ln
- 206 Founders Pointe Blvd
- 321 Devonshire Dr
- 319 Devonshire Dr
- 204 Lancelot Ln
- 207 Founders Pointe Blvd
- 209 Founders Pointe Blvd
- 204 Founders Pointe Blvd
- 205 Founders Pointe Blvd
- 117 Lancelot Ln
- 323 Devonshire Dr
- 300 Founders Pointe Blvd
- 317 Devonshire Dr
- 126 Wilshire Dr
- 124 Wilshire Dr
- 501 Sharpe Dr
- 206 Lancelot Ln
- 315 Devonshire Dr
Your Personal Tour Guide
Ask me questions while you tour the home.