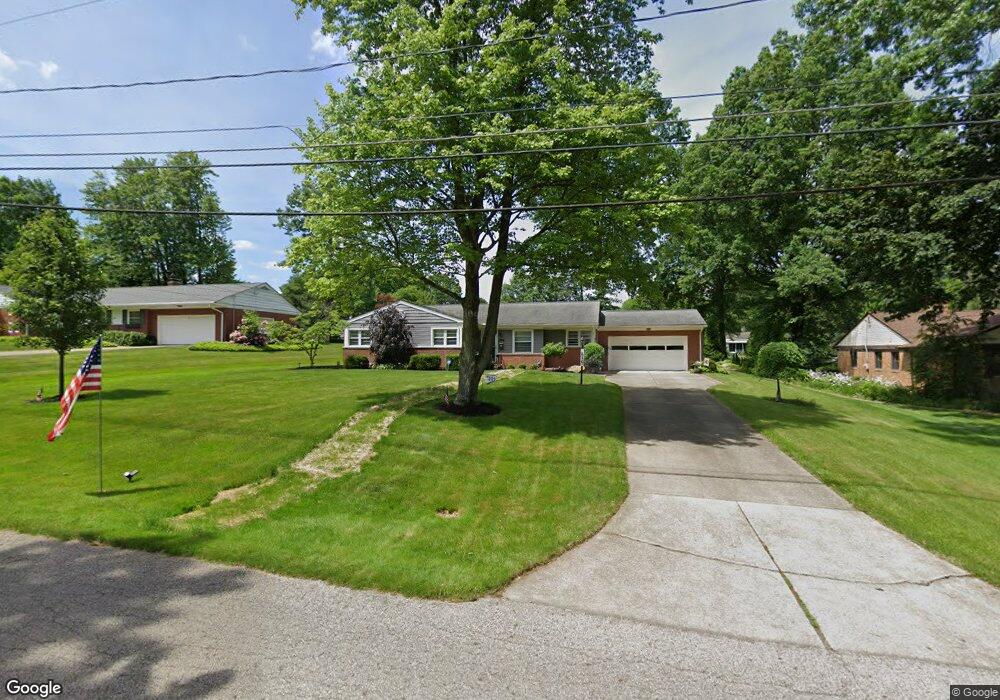
210 Glenview Rd Canfield, OH 44406
Estimated Value: $260,752 - $299,000
4
Beds
2
Baths
1,756
Sq Ft
$159/Sq Ft
Est. Value
About This Home
This home is located at 210 Glenview Rd, Canfield, OH 44406 and is currently estimated at $279,438, approximately $159 per square foot. 210 Glenview Rd is a home located in Mahoning County with nearby schools including Canfield Village Middle School and Canfield High School.
Ownership History
Date
Name
Owned For
Owner Type
Purchase Details
Closed on
Jun 4, 2020
Sold by
Kyprianou Patricia Mae
Bought by
Thompson Cheryl
Current Estimated Value
Home Financials for this Owner
Home Financials are based on the most recent Mortgage that was taken out on this home.
Original Mortgage
$114,000
Outstanding Balance
$99,929
Interest Rate
3.2%
Mortgage Type
New Conventional
Estimated Equity
$179,509
Purchase Details
Closed on
Feb 28, 2013
Sold by
Kyprianou George
Bought by
Kyprianou Patricia Mae
Purchase Details
Closed on
Oct 29, 2009
Sold by
Johnson James Edward and Johnson Christine Ann
Bought by
Kyprianou George and Kyprianou Patricia Mae
Home Financials for this Owner
Home Financials are based on the most recent Mortgage that was taken out on this home.
Original Mortgage
$104,800
Interest Rate
5.07%
Mortgage Type
New Conventional
Purchase Details
Closed on
Jun 13, 1989
Bought by
Johnson James Elwood
Create a Home Valuation Report for This Property
The Home Valuation Report is an in-depth analysis detailing your home's value as well as a comparison with similar homes in the area
Home Values in the Area
Average Home Value in this Area
Purchase History
| Date | Buyer | Sale Price | Title Company |
|---|---|---|---|
| Thompson Cheryl | $174,000 | None Available | |
| Kyprianou Patricia Mae | -- | Attorney | |
| Kyprianou George | $131,000 | Attorney | |
| Johnson James Elwood | $79,000 | -- |
Source: Public Records
Mortgage History
| Date | Status | Borrower | Loan Amount |
|---|---|---|---|
| Open | Thompson Cheryl | $114,000 | |
| Previous Owner | Kyprianou George | $104,800 |
Source: Public Records
Tax History
| Year | Tax Paid | Tax Assessment Tax Assessment Total Assessment is a certain percentage of the fair market value that is determined by local assessors to be the total taxable value of land and additions on the property. | Land | Improvement |
|---|---|---|---|---|
| 2025 | $2,896 | $77,330 | $15,390 | $61,940 |
| 2024 | $2,911 | $77,330 | $15,390 | $61,940 |
| 2023 | $2,892 | $77,330 | $15,390 | $61,940 |
| 2022 | $2,266 | $51,240 | $13,660 | $37,580 |
| 2021 | $2,199 | $51,240 | $13,660 | $37,580 |
| 2020 | $2,208 | $51,240 | $13,660 | $37,580 |
| 2019 | $2,192 | $47,010 | $12,530 | $34,480 |
| 2018 | $2,165 | $47,010 | $12,530 | $34,480 |
| 2017 | $2,014 | $47,010 | $12,530 | $34,480 |
| 2016 | $1,866 | $42,370 | $11,000 | $31,370 |
| 2015 | $1,824 | $42,370 | $11,000 | $31,370 |
| 2014 | -- | $42,370 | $11,000 | $31,370 |
| 2013 | $1,765 | $42,370 | $11,000 | $31,370 |
Source: Public Records
Map
Nearby Homes
- 30 Newton Square Dr Unit 3
- 36 Hilltop Blvd
- 317 Verdant Ln
- 71 Hilltop Blvd
- 264 W Main St
- 315 W Main St
- 9 Willow Way
- 91 Villa Theresa Ln
- 71 Villa Theresa Ln
- 81 Villa Theresa Ln
- 61 Villa Theresa Ln
- 51 Villa Theresa Ln
- 124 Wadsworth St
- 90 Villa Theresa Ln
- 31 Villa Theresa Ln
- 80 Villa Theresa Ln
- 21 Villa Theresa Ln
- 41 Villa Theresa Ln
- 492 Hickory Hollow Dr
- 30 Villa Theresa Ln
- 200 Glenview Rd
- 220 Glenview Rd
- 211 Northview Rd
- 190 Glenview Rd
- 230 Glenview Rd
- 221 Northview Rd
- 201 Northview Rd
- 211 Glenview Rd
- 221 Glenview Rd
- 201 Glenview Rd
- 231 Northview Rd
- 240 Glenview Rd
- 180 Glenview Rd
- 185 Northview Rd
- 231 Glenview Rd
- 191 Glenview Rd
- 241 Northview Rd
- 181 Glenview Rd
- 241 Glenview Rd
- 170 Glenview Rd
Your Personal Tour Guide
Ask me questions while you tour the home.