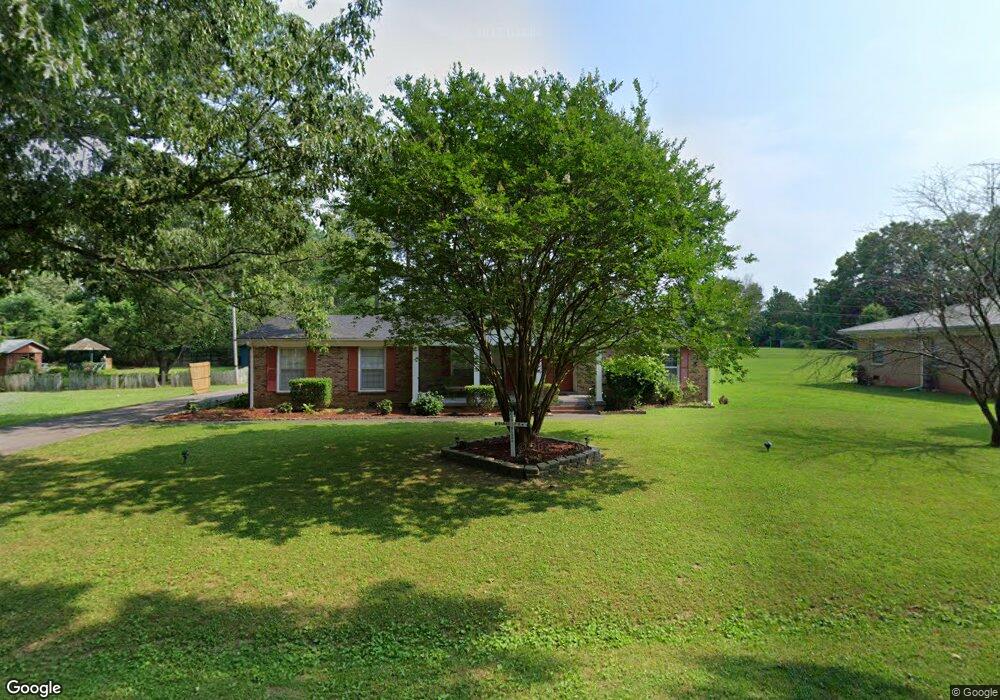
210 Janice Rd Bolivar, TN 38008
Estimated Value: $211,470 - $253,000
--
Bed
2
Baths
1,954
Sq Ft
$116/Sq Ft
Est. Value
About This Home
This home is located at 210 Janice Rd, Bolivar, TN 38008 and is currently estimated at $226,118, approximately $115 per square foot. 210 Janice Rd is a home located in Hardeman County with nearby schools including Bolivar Elementary School, Bolivar Middle School, and Central High School.
Ownership History
Date
Name
Owned For
Owner Type
Purchase Details
Closed on
Apr 10, 2023
Sold by
Wein Thomas R
Bought by
A2z Management Llc
Current Estimated Value
Home Financials for this Owner
Home Financials are based on the most recent Mortgage that was taken out on this home.
Original Mortgage
$227,272
Outstanding Balance
$221,104
Interest Rate
6.73%
Mortgage Type
FHA
Estimated Equity
$5,014
Purchase Details
Closed on
Apr 29, 2021
Sold by
Schlueter Penny
Bought by
Wein Thomas R
Purchase Details
Closed on
Dec 15, 2014
Sold by
Schlueter Penny S
Bought by
Schlueter Penny
Purchase Details
Closed on
Dec 28, 2010
Sold by
Powers Anna A
Bought by
Neilson Earnest E
Purchase Details
Closed on
Jun 20, 2006
Sold by
Fox Michael E
Bought by
Powers Anna A
Purchase Details
Closed on
Dec 29, 1995
Sold by
Jimmie Young
Bought by
Fox Michael E
Purchase Details
Closed on
Jun 9, 1965
Bought by
Young Jimmie and Young Grace J
Create a Home Valuation Report for This Property
The Home Valuation Report is an in-depth analysis detailing your home's value as well as a comparison with similar homes in the area
Home Values in the Area
Average Home Value in this Area
Purchase History
| Date | Buyer | Sale Price | Title Company |
|---|---|---|---|
| A2z Management Llc | $150,000 | Hornsby Title | |
| Wein Thomas R | -- | None Available | |
| Schlueter Penny | -- | -- | |
| Neilson Earnest E | $85,000 | -- | |
| Powers Anna A | $125,000 | -- | |
| Fox Michael E | $65,000 | -- | |
| Young Jimmie | -- | -- |
Source: Public Records
Mortgage History
| Date | Status | Borrower | Loan Amount |
|---|---|---|---|
| Open | A2z Management Llc | $227,272 |
Source: Public Records
Tax History Compared to Growth
Tax History
| Year | Tax Paid | Tax Assessment Tax Assessment Total Assessment is a certain percentage of the fair market value that is determined by local assessors to be the total taxable value of land and additions on the property. | Land | Improvement |
|---|---|---|---|---|
| 2024 | $968 | $47,525 | $3,750 | $43,775 |
| 2023 | $968 | $47,525 | $3,750 | $43,775 |
| 2022 | $749 | $25,150 | $3,125 | $22,025 |
| 2021 | $749 | $25,150 | $3,125 | $22,025 |
| 2020 | $1,039 | $25,150 | $3,125 | $22,025 |
| 2019 | $1,145 | $25,150 | $3,125 | $22,025 |
| 2018 | $1,145 | $28,000 | $3,125 | $24,875 |
| 2017 | $1,171 | $28,700 | $3,125 | $25,575 |
| 2016 | $1,171 | $28,700 | $3,125 | $25,575 |
| 2015 | $1,063 | $28,700 | $3,125 | $25,575 |
| 2014 | $1,063 | $28,700 | $3,125 | $25,575 |
Source: Public Records
Map
Nearby Homes
- 1387 W Market St
- 1420 Virginia Dr
- 27.44 AC U S Highway 64
- 000 Pleasant Creek Ln
- 318 Central St
- 240 Shelby Ln
- 1038 Lake St
- 701 Tennessee St
- 624 Ridgeway Dr
- 604 Neely St
- 724 Paula St
- 619 Clifft St
- 308 Lake Circle Dr
- 116 Meadowbrook Rd
- 115 Meadowbrook Dr
- 0 James Rd
- 295 Sain Rd
- 200 Cross St
- 23500 Tennessee 125
- 220 Barrett St