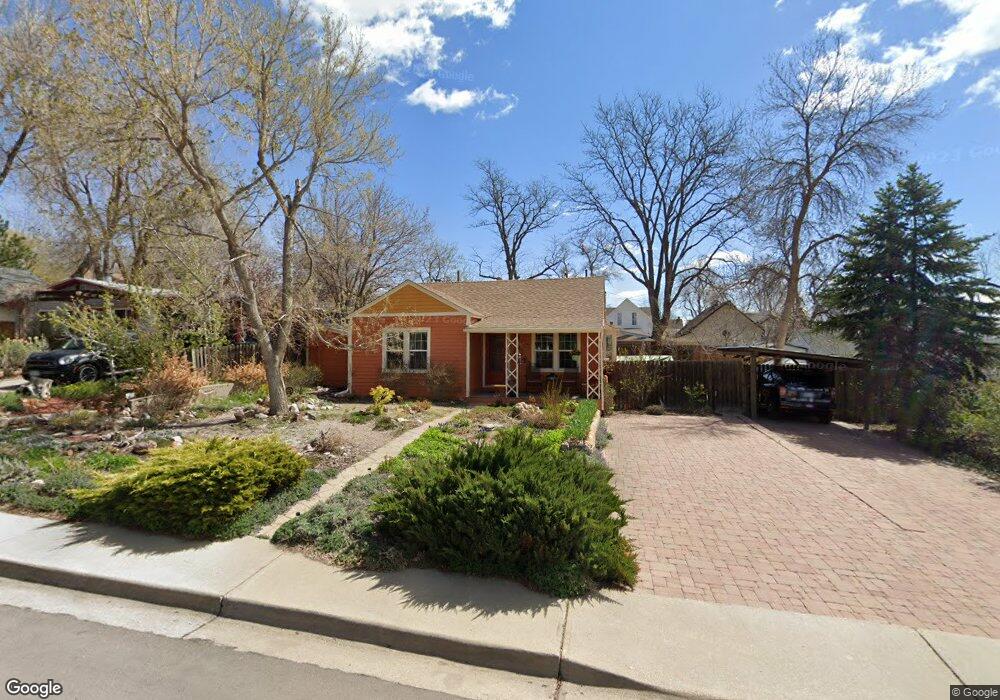
210 Lincoln St Unit 210 1/2 Longmont, CO 80501
Sunset NeighborhoodEstimated Value: $716,837 - $768,000
2
Beds
1
Bath
1,022
Sq Ft
$729/Sq Ft
Est. Value
About This Home
This home is located at 210 Lincoln St Unit 210 1/2, Longmont, CO 80501 and is currently estimated at $745,459, approximately $729 per square foot. 210 Lincoln St Unit 210 1/2 is a home located in Boulder County with nearby schools including Central Elementary School, Westview Middle School, and Longmont High School.
Ownership History
Date
Name
Owned For
Owner Type
Purchase Details
Closed on
Oct 11, 2024
Sold by
Jean Jasmine
Bought by
Stewart Tricia C
Current Estimated Value
Home Financials for this Owner
Home Financials are based on the most recent Mortgage that was taken out on this home.
Original Mortgage
$250,000
Outstanding Balance
$247,372
Interest Rate
6.35%
Mortgage Type
New Conventional
Estimated Equity
$498,087
Purchase Details
Closed on
Oct 31, 1997
Sold by
Mckinney Marian R and Mckinney James L
Bought by
Jasmine Jean
Home Financials for this Owner
Home Financials are based on the most recent Mortgage that was taken out on this home.
Original Mortgage
$12,045
Interest Rate
7.27%
Mortgage Type
Stand Alone Second
Purchase Details
Closed on
Aug 4, 1997
Sold by
Mckinney Marian R
Bought by
Mckinney Marian R
Purchase Details
Closed on
Apr 12, 1993
Bought by
Jean Jasmine
Create a Home Valuation Report for This Property
The Home Valuation Report is an in-depth analysis detailing your home's value as well as a comparison with similar homes in the area
Home Values in the Area
Average Home Value in this Area
Purchase History
| Date | Buyer | Sale Price | Title Company |
|---|---|---|---|
| Stewart Tricia C | $750,000 | Land Title Guarantee | |
| Jasmine Jean | $54,687 | -- | |
| Jasmine Jean | $62,500 | -- | |
| Jasmine Jean | -- | -- | |
| Mckinney Marian R | -- | -- | |
| Jean Jasmine | -- | -- |
Source: Public Records
Mortgage History
| Date | Status | Borrower | Loan Amount |
|---|---|---|---|
| Open | Stewart Tricia C | $250,000 | |
| Previous Owner | Jasmine Jean | $12,045 | |
| Previous Owner | Jasmine Jean | $100,000 |
Source: Public Records
Tax History Compared to Growth
Tax History
| Year | Tax Paid | Tax Assessment Tax Assessment Total Assessment is a certain percentage of the fair market value that is determined by local assessors to be the total taxable value of land and additions on the property. | Land | Improvement |
|---|---|---|---|---|
| 2025 | $4,252 | $44,676 | $11,438 | $33,238 |
| 2024 | $4,252 | $44,676 | $11,438 | $33,238 |
| 2023 | $4,194 | $44,448 | $12,864 | $35,269 |
| 2022 | $3,713 | $37,523 | $9,424 | $28,099 |
| 2021 | $2,651 | $27,213 | $9,695 | $17,518 |
| 2020 | $2,430 | $25,018 | $7,651 | $17,367 |
| 2019 | $2,392 | $25,018 | $7,651 | $17,367 |
| 2018 | $2,145 | $22,586 | $8,784 | $13,802 |
| 2017 | $2,116 | $24,970 | $9,711 | $15,259 |
| 2016 | $1,902 | $19,900 | $11,224 | $8,676 |
| 2015 | $1,813 | $14,718 | $5,174 | $9,544 |
| 2014 | $1,375 | $14,718 | $5,174 | $9,544 |
Source: Public Records
Map
Nearby Homes
- 207 Lincoln St
- 1129 2nd Ave
- 1 Sherman Ct
- 150 Francis St
- 140 Judson St
- 1421 Spruce Ave
- 159 Judson St
- 201 Pratt St
- 831 4th Ave
- 402 Sherman St
- 219 Terry St
- 409 Terry St Unit D
- 409 Terry St Unit B
- 1701 Short Place
- 103 Sunset St Unit A
- 309 Sheley Ct Unit 98
- 421 Barnard Ct Unit 61
- 818 Lincoln St
- 814 Gay St
- 746 Sumner St
- 214 Lincoln St
- 200 Lincoln St
- 218 Lincoln St
- 207 Bowen St
- 207 Bowen St Unit A
- 211 Bowen St
- 222 Lincoln St Unit 222
- 215 Bowen St Unit 2
- 224 Lincoln St Unit 224
- 211 Lincoln St
- 211 Lincoln St Unit 211 1/2
- 203 Lincoln St
- 203 Bowen St
- 138 Lincoln St
- 201 Bowen St
- 215 Lincoln St
- 201 Lincoln St
- 213 Bowen St
- 136 Lincoln St
- 219 Lincoln St