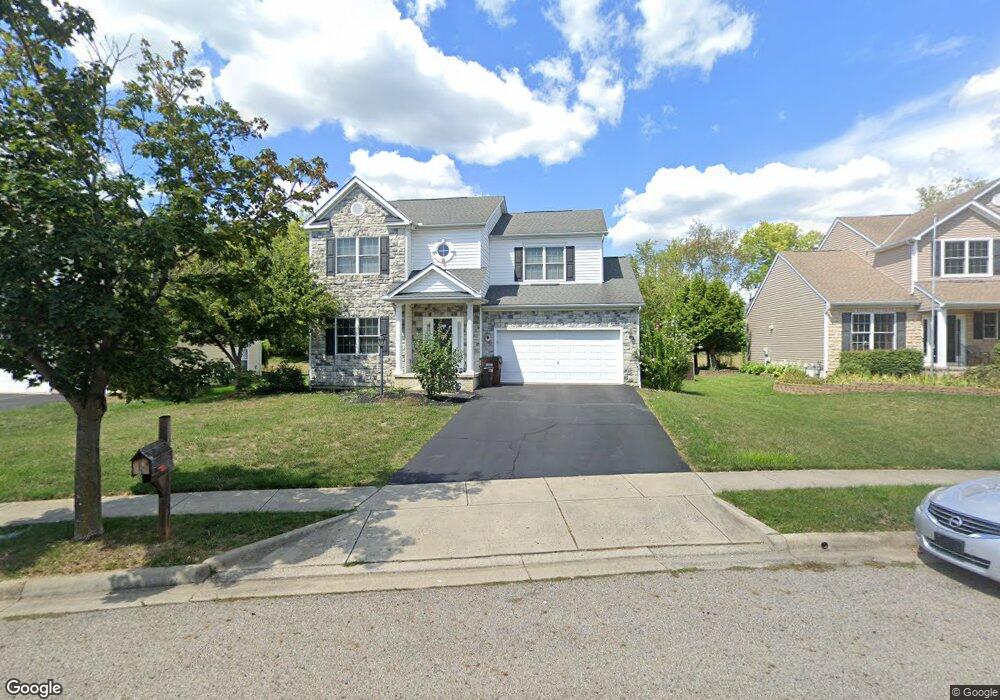
210 Longleaf St Unit 156 Pickerington, OH 43147
Estimated Value: $457,012 - $481,000
4
Beds
3
Baths
2,471
Sq Ft
$190/Sq Ft
Est. Value
About This Home
This home is located at 210 Longleaf St Unit 156, Pickerington, OH 43147 and is currently estimated at $469,253, approximately $189 per square foot. 210 Longleaf St Unit 156 is a home located in Fairfield County with nearby schools including Sycamore Creek Elementary School, Diley Middle School, and Pickerington Ridgeview Junior High School.
Ownership History
Date
Name
Owned For
Owner Type
Purchase Details
Closed on
May 25, 2023
Sold by
Barkley Christine M
Bought by
Abraham Kyle Timothy and Abraham Brittany Leigh
Current Estimated Value
Home Financials for this Owner
Home Financials are based on the most recent Mortgage that was taken out on this home.
Original Mortgage
$383,350
Outstanding Balance
$371,662
Interest Rate
5.88%
Mortgage Type
Credit Line Revolving
Estimated Equity
$97,591
Purchase Details
Closed on
Jun 20, 2008
Sold by
Dominion Homes Inc
Bought by
Barkley Christine M and Obrien Jason A
Home Financials for this Owner
Home Financials are based on the most recent Mortgage that was taken out on this home.
Original Mortgage
$250,962
Interest Rate
6.05%
Mortgage Type
Purchase Money Mortgage
Create a Home Valuation Report for This Property
The Home Valuation Report is an in-depth analysis detailing your home's value as well as a comparison with similar homes in the area
Home Values in the Area
Average Home Value in this Area
Purchase History
| Date | Buyer | Sale Price | Title Company |
|---|---|---|---|
| Abraham Kyle Timothy | $451,000 | None Listed On Document | |
| Barkley Christine M | $253,000 | Alliance Title |
Source: Public Records
Mortgage History
| Date | Status | Borrower | Loan Amount |
|---|---|---|---|
| Open | Abraham Kyle Timothy | $383,350 | |
| Previous Owner | Barkley Christine M | $250,962 |
Source: Public Records
Tax History Compared to Growth
Tax History
| Year | Tax Paid | Tax Assessment Tax Assessment Total Assessment is a certain percentage of the fair market value that is determined by local assessors to be the total taxable value of land and additions on the property. | Land | Improvement |
|---|---|---|---|---|
| 2024 | $14,631 | $118,850 | $15,830 | $103,020 |
| 2023 | $5,603 | $118,850 | $15,830 | $103,020 |
| 2022 | $5,621 | $118,850 | $15,830 | $103,020 |
| 2021 | $4,838 | $87,110 | $15,070 | $72,040 |
| 2020 | $4,891 | $87,110 | $15,070 | $72,040 |
| 2019 | $4,922 | $87,110 | $15,070 | $72,040 |
| 2018 | $4,809 | $76,230 | $15,070 | $61,160 |
| 2017 | $4,816 | $74,190 | $13,480 | $60,710 |
| 2016 | $4,792 | $74,190 | $13,480 | $60,710 |
| 2015 | $4,569 | $66,890 | $11,240 | $55,650 |
| 2014 | $4,514 | $66,890 | $11,240 | $55,650 |
| 2013 | $4,514 | $66,890 | $11,240 | $55,650 |
Source: Public Records
Map
Nearby Homes
- 116 Kohler St
- 147 Longleaf St
- 317 Audubon St
- 318 Linden Cir
- 184 Pickerington Ponds Dr
- 9672 Schoolhouse Rd
- 180 Pickerington Ponds Dr
- 143 Pickerington Ponds Dr
- Winston Plan at The Reserve at Pickerington Ponds - Designer Collection
- Emmett Plan at The Reserve at Pickerington Ponds - Designer Collection
- Carrington Plan at The Reserve at Pickerington Ponds - Designer Collection
- Blair Plan at The Reserve at Pickerington Ponds - Designer Collection
- Charles Plan at The Reserve at Pickerington Ponds - Designer Collection
- Wyatt Plan at The Reserve at Pickerington Ponds - Designer Collection
- Avery Plan at The Reserve at Pickerington Ponds - Designer Collection
- Calvin Plan at The Reserve at Pickerington Ponds - Designer Collection
- 117 Sparrow Ct
- Edgewood Plan at The Reserve at Pickerington Ponds - Reserve
- Palmetto Plan at The Reserve at Pickerington Ponds - Reserve
- Galveston Plan at The Reserve at Pickerington Ponds - Reserve
- 210 Longleaf St
- 206 Longleaf St
- 214 Longleaf St
- 202 Longleaf St
- 202 Longleaf St Unit 188
- 187 Longleaf St
- 187 Longleaf St Unit 254
- 183 Longleaf St
- 183 Longleaf St Unit 253
- 245 Longleaf St
- 243 Pickerington Ponds Dr
- 198 Longleaf St
- 179 Longleaf St
- 179 Longleaf St Unit 252
- 216 Longleaf St
- 216 Longleaf St Unit 255
- 219 Longleaf St
- 247 Pickerington Ponds Dr
- 194 Longleaf St
- 194 Longleaf St Unit 190