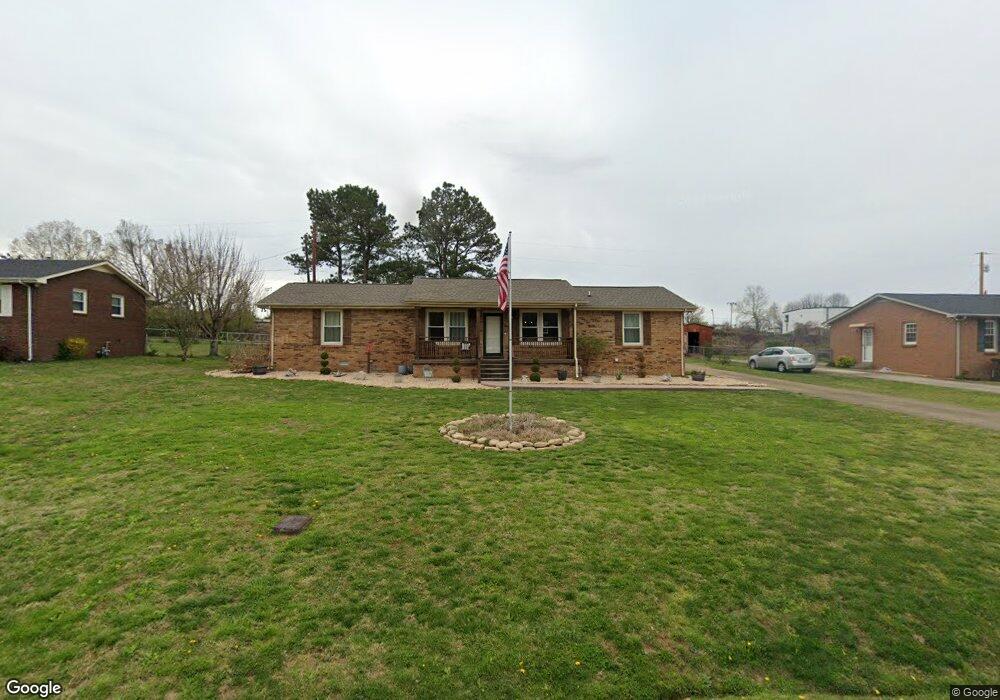
210 Lyle Ln Dickson, TN 37055
Estimated Value: $298,919 - $370,000
Studio
2
Baths
1,600
Sq Ft
$214/Sq Ft
Est. Value
About This Home
This home is located at 210 Lyle Ln, Dickson, TN 37055 and is currently estimated at $342,980, approximately $214 per square foot. 210 Lyle Ln is a home located in Dickson County with nearby schools including Oakmont Elementary School, Dickson Middle School, and Dickson County High School.
Ownership History
Date
Name
Owned For
Owner Type
Purchase Details
Closed on
Oct 10, 2017
Sold by
Edwards Belinda
Bought by
Springer Scott E and Springer Donna
Current Estimated Value
Home Financials for this Owner
Home Financials are based on the most recent Mortgage that was taken out on this home.
Original Mortgage
$117,000
Outstanding Balance
$60,869
Interest Rate
3.78%
Mortgage Type
New Conventional
Estimated Equity
$282,111
Purchase Details
Closed on
May 30, 2002
Sold by
Bradford Sandra S
Bought by
Edwards Belinda
Purchase Details
Closed on
Aug 9, 1995
Sold by
Anderson Jerry
Bought by
Bradford Sandra S
Purchase Details
Closed on
Jul 28, 1995
Sold by
Anderson Jerry
Bought by
Bradford Sandra S
Purchase Details
Closed on
May 9, 1995
Sold by
Wade Vera L Anderson
Bought by
Anderson Jerry
Purchase Details
Closed on
Apr 11, 1986
Bought by
Wade Vera L Anderson Le Jerry Ander
Purchase Details
Closed on
Jan 1, 1983
Create a Home Valuation Report for This Property
The Home Valuation Report is an in-depth analysis detailing your home's value as well as a comparison with similar homes in the area
Home Values in the Area
Average Home Value in this Area
Purchase History
| Date | Buyer | Sale Price | Title Company |
|---|---|---|---|
| Springer Scott E | $154,900 | -- | |
| Edwards Belinda | $106,500 | -- | |
| Bradford Sandra S | $73,900 | -- | |
| Bradford Sandra S | $73,900 | -- | |
| Anderson Jerry | -- | -- | |
| Wade Vera L Anderson Le Jerry Ander | $44,000 | -- | |
| -- | $44,000 | -- |
Source: Public Records
Mortgage History
| Date | Status | Borrower | Loan Amount |
|---|---|---|---|
| Open | Springer Scott E | $117,000 |
Source: Public Records
Tax History
| Year | Tax Paid | Tax Assessment Tax Assessment Total Assessment is a certain percentage of the fair market value that is determined by local assessors to be the total taxable value of land and additions on the property. | Land | Improvement |
|---|---|---|---|---|
| 2025 | -- | $80,950 | $13,000 | $67,950 |
| 2024 | -- | $80,950 | $13,000 | $67,950 |
| 2023 | $1,850 | $59,225 | $9,950 | $49,275 |
| 2022 | $1,850 | $59,225 | $9,950 | $49,275 |
| 2021 | $1,579 | $59,225 | $9,950 | $49,275 |
| 2020 | $1,579 | $50,550 | $9,950 | $40,600 |
| 2019 | $1,579 | $50,550 | $9,950 | $40,600 |
| 2018 | $1,196 | $32,775 | $4,325 | $28,450 |
| 2017 | $1,196 | $32,775 | $4,325 | $28,450 |
| 2016 | $1,196 | $32,775 | $4,325 | $28,450 |
| 2015 | $1,091 | $28,125 | $4,325 | $23,800 |
| 2014 | $1,091 | $28,125 | $4,325 | $23,800 |
Source: Public Records
Map
Nearby Homes
- 501 Caraway Ct
- 161 Caraway Ct
- 211 W Hills Terrace
- 101 Sunset Rd
- 101 W Hills Terrace
- 422 Shady Hill Rd
- 101 Birch St
- 0 Highway 46 Unit RTC2944647
- 101 Lake Circle Dr
- 0 Henslee Dr Spring St Unit RTC3128657
- 815 Highway 70 E
- 1103 Cowan Rd
- 1087 Cowan Rd
- 108 W Quail Hollow Way
- 500 Church St
- 3232 Tennessee 46
- 3230 Tennessee 46
- 0 Tucker Rd Unit RTC3051077
- 207 Robinson Dr
- 1003 Autumnwood Dr
- 208 Lyle Ln
- 300 Lyle Ln
- 208 Sunset Rd
- 302 Lyle Ln
- 209 Sunset Rd
- 206 Sunset Rd
- 0 Railroad St Unit 1949822
- 207 Sunset Rd
- 304 Lyle Ln
- 505 Caraway Ct
- 205 Sunset Rd
- 601 Caraway Ct
- 503 Caraway Ct
- 501 Caraway Ct Unit 14
- 306 Lyle Ln
- 206 Royal Oak Dr
- 603 Caraway Ct
- 471 Caraway Ct
- 605 Caraway Ct
- 204 Royal Oak Dr
Your Personal Tour Guide
Ask me questions while you tour the home.