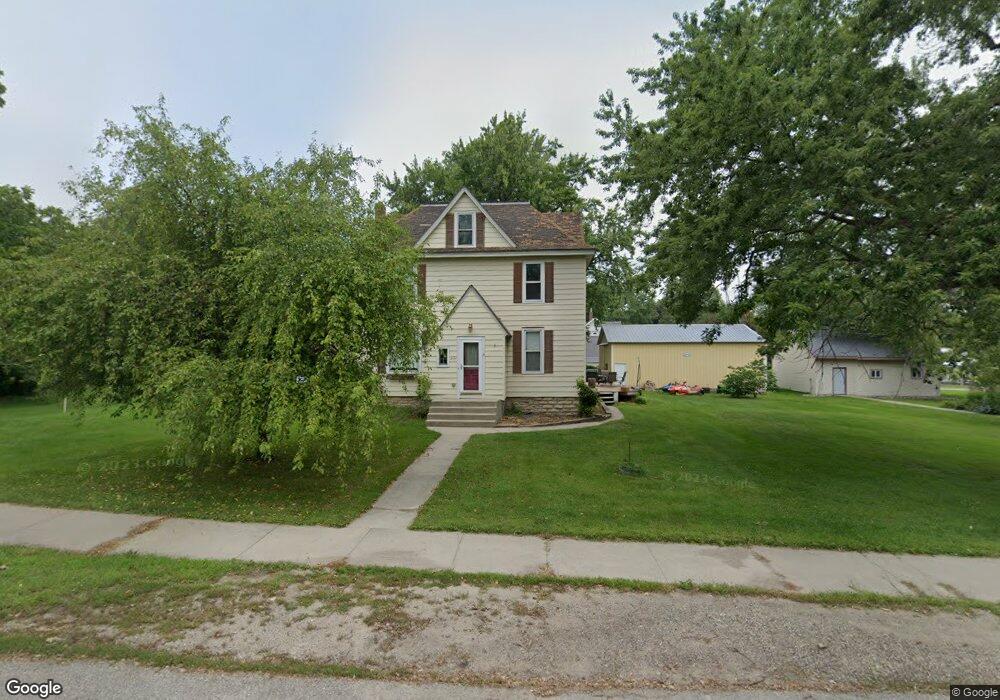
210 Main St Nerstrand, MN 55053
Estimated Value: $232,000 - $320,000
4
Beds
2
Baths
1,941
Sq Ft
$149/Sq Ft
Est. Value
About This Home
This home is located at 210 Main St, Nerstrand, MN 55053 and is currently estimated at $288,602, approximately $148 per square foot. 210 Main St is a home located in Rice County with nearby schools including Roosevelt Elementary School, Faribault Middle School, and Faribault Senior High School.
Ownership History
Date
Name
Owned For
Owner Type
Purchase Details
Closed on
May 13, 2016
Sold by
Harris Amy L and Harris John R
Bought by
Wang Victor
Current Estimated Value
Home Financials for this Owner
Home Financials are based on the most recent Mortgage that was taken out on this home.
Original Mortgage
$178,703
Outstanding Balance
$141,935
Interest Rate
3.59%
Mortgage Type
FHA
Estimated Equity
$146,667
Purchase Details
Closed on
Jun 29, 2007
Sold by
Evavold Todd A and Evavold Annette R
Bought by
Harris Amy L and Harris John R
Purchase Details
Closed on
May 1, 2003
Sold by
Isaacson Marlys A
Bought by
Evavold Todd A and Evavold Annette R
Create a Home Valuation Report for This Property
The Home Valuation Report is an in-depth analysis detailing your home's value as well as a comparison with similar homes in the area
Purchase History
| Date | Buyer | Sale Price | Title Company |
|---|---|---|---|
| Wang Victor | $182,000 | Edina Realty Title Inc | |
| Harris Amy L | $225,000 | -- | |
| Evavold Todd A | $135,000 | -- |
Source: Public Records
Mortgage History
| Date | Status | Borrower | Loan Amount |
|---|---|---|---|
| Open | Wang Victor | $178,703 |
Source: Public Records
Tax History
| Year | Tax Paid | Tax Assessment Tax Assessment Total Assessment is a certain percentage of the fair market value that is determined by local assessors to be the total taxable value of land and additions on the property. | Land | Improvement |
|---|---|---|---|---|
| 2025 | $2,942 | $306,600 | $78,200 | $228,400 |
| 2024 | $2,942 | $260,300 | $65,200 | $195,100 |
| 2023 | $2,736 | $260,300 | $65,200 | $195,100 |
| 2022 | $2,452 | $234,700 | $60,000 | $174,700 |
| 2021 | $2,380 | $204,500 | $48,200 | $156,300 |
| 2020 | $2,222 | $200,600 | $48,200 | $152,400 |
| 2019 | $1,978 | $191,700 | $48,200 | $143,500 |
| 2018 | $1,966 | $175,700 | $48,200 | $127,500 |
| 2017 | $1,958 | $170,900 | $48,200 | $122,700 |
| 2016 | $2,072 | $167,700 | $48,200 | $119,500 |
| 2015 | $1,366 | $155,300 | $45,800 | $109,500 |
| 2014 | -- | $133,300 | $45,800 | $87,500 |
Source: Public Records
Map
Nearby Homes
Your Personal Tour Guide
Ask me questions while you tour the home.