210 Mallard Loop Whitefish, MT 59937
Estimated Value: $778,714 - $865,000
4
Beds
2
Baths
2,572
Sq Ft
$323/Sq Ft
Est. Value
About This Home
This home is located at 210 Mallard Loop, Whitefish, MT 59937 and is currently estimated at $831,429, approximately $323 per square foot. 210 Mallard Loop is a home located in Flathead County with nearby schools including L.A. Muldown School, Whitefish Middle School, and Whitefish High School.
Ownership History
Date
Name
Owned For
Owner Type
Purchase Details
Closed on
Oct 18, 2021
Sold by
Holloway Michael
Bought by
Holloway Tara and Holloway Kyle
Current Estimated Value
Purchase Details
Closed on
Jul 21, 2015
Sold by
Holloway Michael and Wise Sedona
Bought by
Holloway Michael
Purchase Details
Closed on
Oct 14, 2013
Sold by
Pogue Patrick R and Pogue Karen J
Bought by
Holloway Michael and Wise Sedena
Home Financials for this Owner
Home Financials are based on the most recent Mortgage that was taken out on this home.
Original Mortgage
$287,910
Interest Rate
4.49%
Mortgage Type
Seller Take Back
Purchase Details
Closed on
Mar 29, 2006
Sold by
Witzel Theodore W and Witzel Patricia A
Bought by
Pogue Patrick R and Pogue Karen J
Home Financials for this Owner
Home Financials are based on the most recent Mortgage that was taken out on this home.
Original Mortgage
$239,200
Interest Rate
6.2%
Mortgage Type
Future Advance Clause Open End Mortgage
Create a Home Valuation Report for This Property
The Home Valuation Report is an in-depth analysis detailing your home's value as well as a comparison with similar homes in the area
Home Values in the Area
Average Home Value in this Area
Purchase History
| Date | Buyer | Sale Price | Title Company |
|---|---|---|---|
| Holloway Tara | -- | None Listed On Document | |
| Holloway Michael | -- | None Available | |
| Holloway Michael | -- | Atec | |
| Pogue Patrick R | -- | Sterling Title Services Inc |
Source: Public Records
Mortgage History
| Date | Status | Borrower | Loan Amount |
|---|---|---|---|
| Previous Owner | Holloway Michael | $287,910 | |
| Previous Owner | Pogue Patrick R | $239,200 |
Source: Public Records
Tax History
| Year | Tax Paid | Tax Assessment Tax Assessment Total Assessment is a certain percentage of the fair market value that is determined by local assessors to be the total taxable value of land and additions on the property. | Land | Improvement |
|---|---|---|---|---|
| 2025 | $2,595 | $817,600 | $0 | $0 |
| 2024 | $2,599 | $566,900 | $0 | $0 |
| 2023 | $2,807 | $566,900 | $0 | $0 |
| 2022 | $2,780 | $396,700 | $0 | $0 |
| 2021 | $2,788 | $396,700 | $0 | $0 |
| 2020 | $2,711 | $363,400 | $0 | $0 |
| 2019 | $2,890 | $363,400 | $0 | $0 |
| 2018 | $2,647 | $322,900 | $0 | $0 |
| 2017 | $2,243 | $322,900 | $0 | $0 |
| 2016 | $2,230 | $281,700 | $0 | $0 |
| 2015 | $2,200 | $281,700 | $0 | $0 |
| 2014 | $2,223 | $174,794 | $0 | $0 |
Source: Public Records
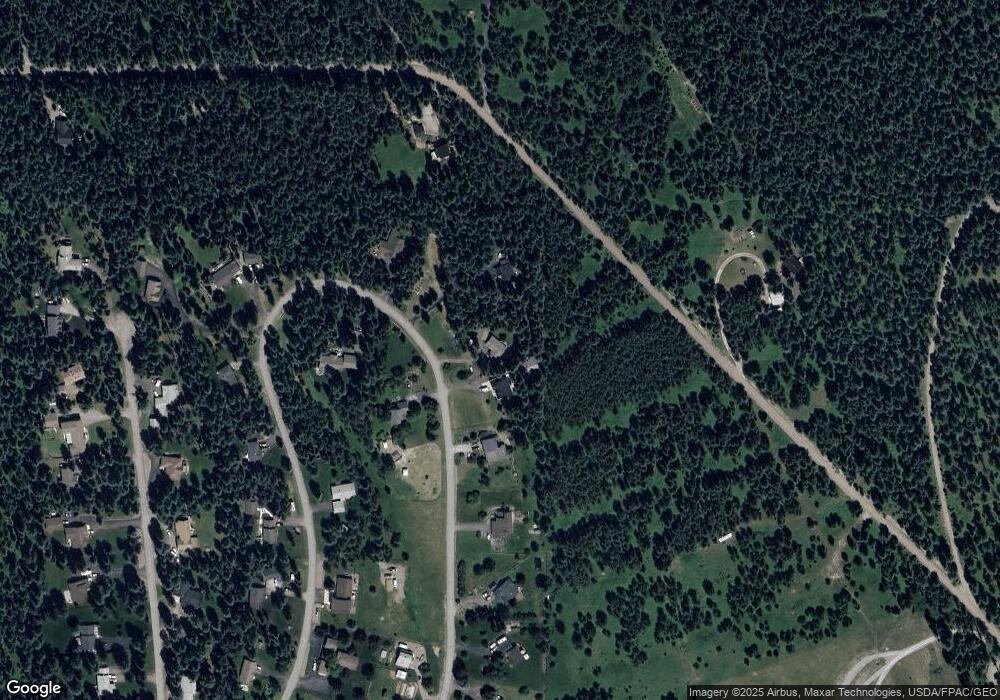
Map
Nearby Homes
- 205 Whitetail Ln
- 129 Mallard Loop
- 35 Stagecoach Dr
- 181 Mallard Loop
- 109 Lidstrom Rd
- 1785 Hodgson Rd
- 272/268 Moose Trail
- 1187 & 1195 Hodgson Rd
- 316 Sandalwood Ln Unit Lot 3
- 142 Rosewood Ln Unit Lot 18
- 182 Rosewood Ln Unit Lot 15
- 185 Rosewood Ln Unit Lot 14
- 149 Rosewood Ln Unit Lot 8
- Address To Be Determ the Woodlands Unit Lot 9
- 161 Rosewood Unit Lot 10
- 257 Fawn Trail
- 444 Bear Trail
- 37 Hodgson Rd
- 400 Sandy Hill Ln
- 229 Sandy Hill Ln
- 206 Mallard Loop
- 206 Mallard Loop
- 214 Mallard Loop
- 159 Mallard Loop
- 218 Mallard Loop
- 202 Mallard Loop
- 155 Mallard Loop
- 167 Wagon Wheel Rd
- NHN Wagon Wheel Rd
- 222 Mallard Loop
- 90 Wagon Wheel Rd
- 149 Mallard Loop
- 80 Wagon Wheel Rd
- 226 Mallard Loop
- 188 Mallard Loop
- 184 Mallard Loop
- 196 Mallard Loop
- 81 Wagon Wheel Rd
- 145 Mallard Loop
- 180 Mallard Loop
Your Personal Tour Guide
Ask me questions while you tour the home.