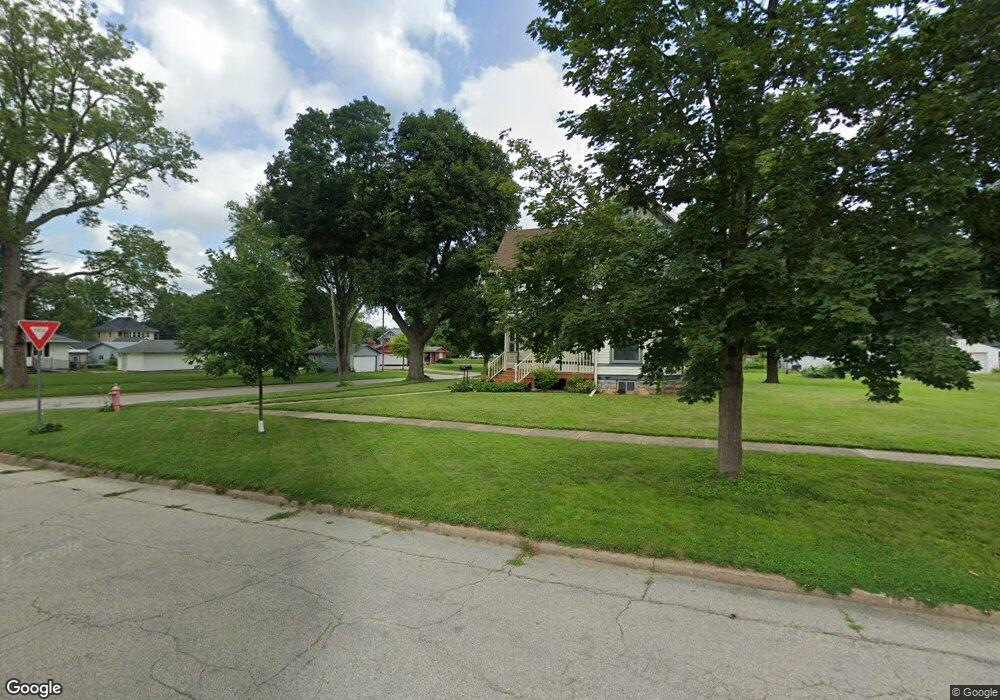
210 Mulberry St Tipton, IA 52772
Estimated Value: $192,000 - $208,737
3
Beds
2
Baths
1,720
Sq Ft
$118/Sq Ft
Est. Value
About This Home
This home is located at 210 Mulberry St, Tipton, IA 52772 and is currently estimated at $203,434, approximately $118 per square foot. 210 Mulberry St is a home located in Cedar County with nearby schools including Tipton Elementary School, Tipton Middle School, and Tipton High School.
Ownership History
Date
Name
Owned For
Owner Type
Purchase Details
Closed on
Jul 17, 2008
Sold by
Schwenker Dennis J and Schwenker Dennis L
Bought by
Schwenker Danielle L
Current Estimated Value
Home Financials for this Owner
Home Financials are based on the most recent Mortgage that was taken out on this home.
Original Mortgage
$77,500
Outstanding Balance
$50,200
Interest Rate
6.15%
Mortgage Type
New Conventional
Estimated Equity
$153,234
Purchase Details
Closed on
Jul 10, 2008
Sold by
Federal National Mortgage Association
Bought by
Schwenker Dennis L and Schwenker Danielle L
Home Financials for this Owner
Home Financials are based on the most recent Mortgage that was taken out on this home.
Original Mortgage
$77,500
Outstanding Balance
$50,200
Interest Rate
6.15%
Mortgage Type
New Conventional
Estimated Equity
$153,234
Create a Home Valuation Report for This Property
The Home Valuation Report is an in-depth analysis detailing your home's value as well as a comparison with similar homes in the area
Home Values in the Area
Average Home Value in this Area
Purchase History
| Date | Buyer | Sale Price | Title Company |
|---|---|---|---|
| Schwenker Danielle L | -- | None Available | |
| Schwenker Dennis L | -- | None Available |
Source: Public Records
Mortgage History
| Date | Status | Borrower | Loan Amount |
|---|---|---|---|
| Open | Schwenker Dennis L | $77,500 |
Source: Public Records
Tax History Compared to Growth
Tax History
| Year | Tax Paid | Tax Assessment Tax Assessment Total Assessment is a certain percentage of the fair market value that is determined by local assessors to be the total taxable value of land and additions on the property. | Land | Improvement |
|---|---|---|---|---|
| 2024 | $2,798 | $174,100 | $24,750 | $149,350 |
| 2023 | $2,558 | $167,590 | $24,750 | $142,840 |
| 2022 | $2,358 | $132,240 | $20,250 | $111,990 |
| 2021 | $2,198 | $132,240 | $20,250 | $111,990 |
| 2020 | $2,064 | $126,020 | $20,250 | $105,770 |
| 2019 | $1,790 | $108,430 | $20,250 | $105,770 |
| 2018 | $1,732 | $108,430 | $0 | $0 |
| 2017 | $1,732 | $110,700 | $0 | $0 |
| 2016 | $1,878 | $110,700 | $0 | $0 |
| 2015 | $1,916 | $109,730 | $0 | $0 |
| 2014 | $1,880 | $109,730 | $0 | $0 |
Source: Public Records
Map
Nearby Homes