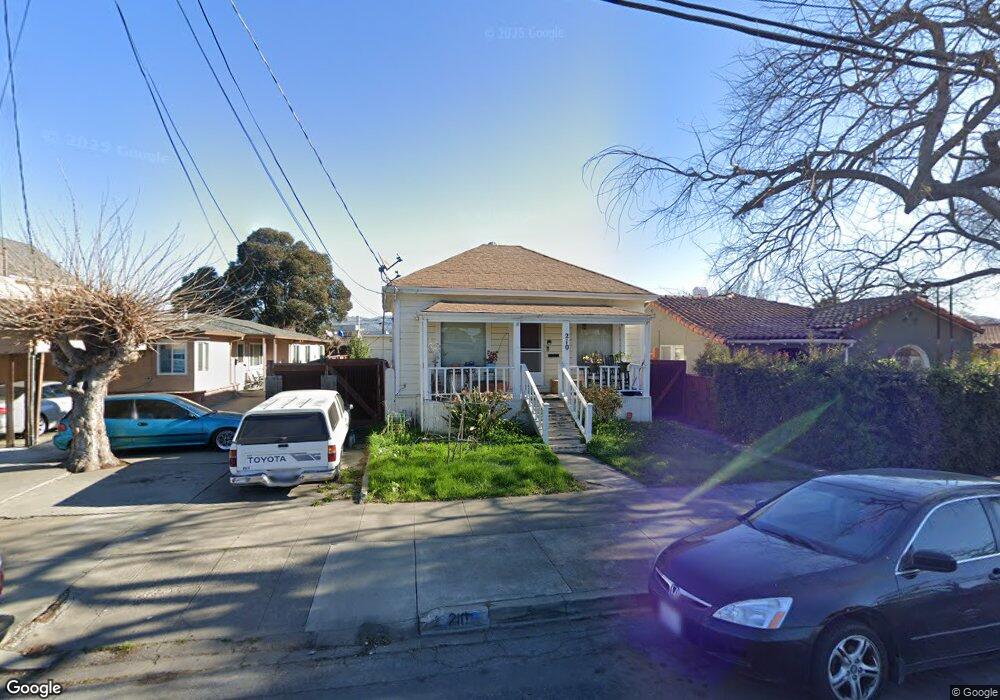
210 N 25th St San Jose, CA 95116
Roosevelt Park NeighborhoodEstimated Value: $813,000 - $850,887
2
Beds
1
Bath
752
Sq Ft
$1,115/Sq Ft
Est. Value
About This Home
This home is located at 210 N 25th St, San Jose, CA 95116 and is currently estimated at $838,472, approximately $1,114 per square foot. 210 N 25th St is a home located in Santa Clara County with nearby schools including Empire Gardens Elementary School, Muwekma Ohlone Middle, and San Jose High School.
Ownership History
Date
Name
Owned For
Owner Type
Purchase Details
Closed on
Jun 23, 2010
Sold by
Harmin Investments #125 Lp
Bought by
Paul Andrew N
Current Estimated Value
Home Financials for this Owner
Home Financials are based on the most recent Mortgage that was taken out on this home.
Original Mortgage
$195,000
Outstanding Balance
$130,304
Interest Rate
4.91%
Mortgage Type
New Conventional
Estimated Equity
$708,168
Purchase Details
Closed on
Feb 8, 2010
Sold by
Sanchez Ramon S
Bought by
Harmin Investments #125 Lp
Purchase Details
Closed on
May 17, 2005
Sold by
Gloria Manuel A and Gloria Idalina
Bought by
Sanchez Ramon S
Home Financials for this Owner
Home Financials are based on the most recent Mortgage that was taken out on this home.
Original Mortgage
$102,600
Interest Rate
5.84%
Mortgage Type
Credit Line Revolving
Purchase Details
Closed on
Aug 15, 1995
Sold by
Howard Bradford D and Cartwright Marie
Bought by
Gloria Manuel A and Gloria Idalina
Home Financials for this Owner
Home Financials are based on the most recent Mortgage that was taken out on this home.
Original Mortgage
$102,200
Interest Rate
7.63%
Create a Home Valuation Report for This Property
The Home Valuation Report is an in-depth analysis detailing your home's value as well as a comparison with similar homes in the area
Home Values in the Area
Average Home Value in this Area
Purchase History
| Date | Buyer | Sale Price | Title Company |
|---|---|---|---|
| Paul Andrew N | $260,000 | Chicago Title Company | |
| Harmin Investments #125 Lp | $199,700 | None Available | |
| Sanchez Ramon S | $513,000 | Fidelity National Title Ins | |
| Gloria Manuel A | $146,000 | Valley Title Company |
Source: Public Records
Mortgage History
| Date | Status | Borrower | Loan Amount |
|---|---|---|---|
| Open | Paul Andrew N | $195,000 | |
| Previous Owner | Sanchez Ramon S | $102,600 | |
| Previous Owner | Sanchez Ramon S | $410,400 | |
| Previous Owner | Gloria Manuel A | $102,200 |
Source: Public Records
Tax History Compared to Growth
Tax History
| Year | Tax Paid | Tax Assessment Tax Assessment Total Assessment is a certain percentage of the fair market value that is determined by local assessors to be the total taxable value of land and additions on the property. | Land | Improvement |
|---|---|---|---|---|
| 2025 | $5,377 | $335,600 | $238,797 | $96,803 |
| 2024 | $5,377 | $329,020 | $234,115 | $94,905 |
| 2023 | $5,241 | $322,570 | $229,525 | $93,045 |
| 2022 | $5,175 | $316,246 | $225,025 | $91,221 |
| 2021 | $5,021 | $310,046 | $220,613 | $89,433 |
| 2020 | $4,874 | $306,867 | $218,351 | $88,516 |
| 2019 | $4,747 | $300,851 | $214,070 | $86,781 |
| 2018 | $4,680 | $294,953 | $209,873 | $85,080 |
| 2017 | $4,573 | $289,170 | $205,758 | $83,412 |
| 2016 | $4,422 | $283,501 | $201,724 | $81,777 |
| 2015 | $4,417 | $279,243 | $198,694 | $80,549 |
| 2014 | $3,952 | $273,774 | $194,802 | $78,972 |
Source: Public Records
Map
Nearby Homes
- 176 N 24th St
- 482 Coyote Creek Cir
- 432 Coyote Creek Cir
- 1249 Coyote Creek Place
- 1247 Coyote Creek Place Unit 1008
- 1246 Coyote Creek Place
- 324 N 20th St
- 55 Carnegie Square
- 30 S 22nd St Unit 6
- 30 S 22nd St Unit 2
- 75 S 24th St
- 39 S 23rd St
- 412 N 21st St
- 326 N 19th St
- 18 S 21st St Unit 200
- 307 Destino Cir
- 1508 Marburg Way
- 1565 E Saint James St
- 842 E Julian St
- 1236 Whitton Ave