Estimated Value: $251,781
3
Beds
1
Bath
1,184
Sq Ft
$213/Sq Ft
Est. Value
About This Home
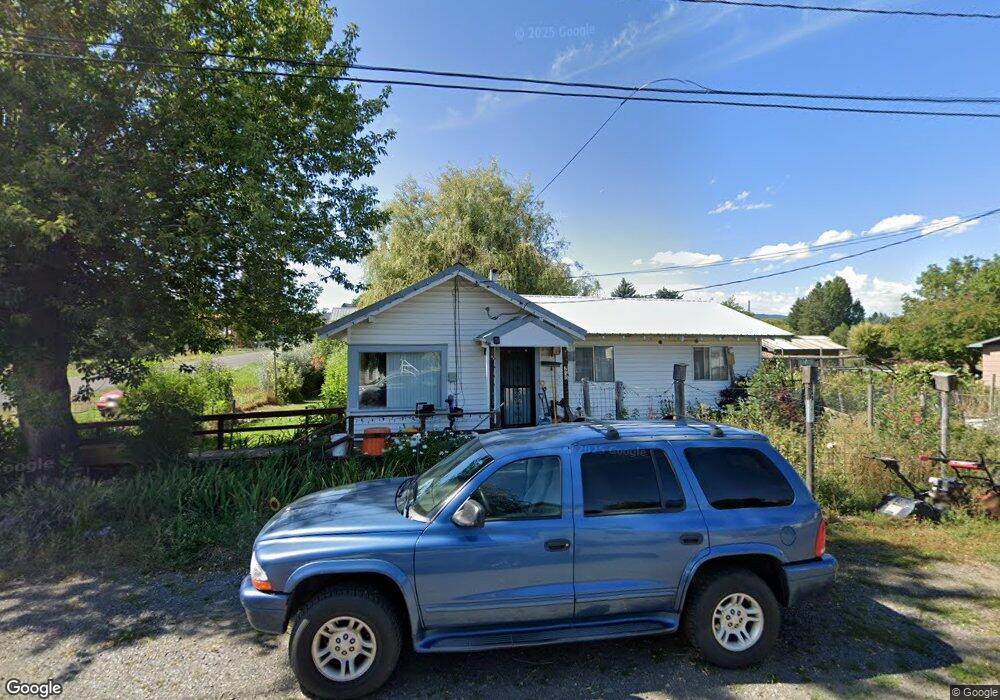
This home is located at 210 N 4th Ave, Elgin, OR 97827 and is currently estimated at $251,781, approximately $212 per square foot. 210 N 4th Ave is a home located in Union County with nearby schools including Stella Mayfield Elementary School and Elgin High School.
Ownership History
Date
Name
Owned For
Owner Type
Purchase Details
Closed on
Feb 5, 2024
Sold by
Boots Scott S
Bought by
Griffith Glen G and Griffith Kelley G
Current Estimated Value
Purchase Details
Closed on
Jan 30, 2009
Sold by
Boots Dean S and Boots Marble E
Bought by
Boots Dean S and Boots Mable E
Purchase Details
Closed on
Jan 22, 2006
Sold by
The Secretary Of Hud
Bought by
Horn Troy Emmett and Horn Becky R
Home Financials for this Owner
Home Financials are based on the most recent Mortgage that was taken out on this home.
Original Mortgage
$54,800
Interest Rate
6.15%
Mortgage Type
New Conventional
Purchase Details
Closed on
Jul 20, 2005
Sold by
Collins Sara J
Bought by
Citimortgage Inc
Create a Home Valuation Report for This Property
The Home Valuation Report is an in-depth analysis detailing your home's value as well as a comparison with similar homes in the area
Purchase History
| Date | Buyer | Sale Price | Title Company |
|---|---|---|---|
| Griffith Glen G | $15,000 | Eastern Oregon Title | |
| Boots Dean S | $2,500 | None Available | |
| Horn Troy Emmett | $68,600 | None Available | |
| Citimortgage Inc | $119,061 | None Available |
Source: Public Records
Mortgage History
| Date | Status | Borrower | Loan Amount |
|---|---|---|---|
| Previous Owner | Horn Troy Emmett | $54,800 |
Source: Public Records
Tax History
| Year | Tax Paid | Tax Assessment Tax Assessment Total Assessment is a certain percentage of the fair market value that is determined by local assessors to be the total taxable value of land and additions on the property. | Land | Improvement |
|---|---|---|---|---|
| 2025 | $2,007 | $105,830 | $31,550 | $74,280 |
| 2024 | $1,648 | $91,475 | $19,345 | $72,130 |
| 2023 | $1,901 | $105,490 | $37,420 | $68,070 |
| 2022 | $1,846 | $102,433 | $36,333 | $66,100 |
| 2021 | $1,792 | $99,450 | $35,480 | $63,970 |
| 2020 | $1,740 | $96,554 | $32,667 | $63,887 |
| 2019 | $1,689 | $93,742 | $31,860 | $61,882 |
| 2018 | $1,640 | $91,012 | $31,104 | $59,908 |
| 2017 | $1,570 | $88,362 | $30,414 | $57,948 |
| 2016 | $1,446 | $85,789 | $29,758 | $56,031 |
| 2015 | $1,308 | $83,291 | $28,822 | $54,469 |
| 2014 | $1,346 | $80,866 | $27,221 | $53,645 |
| 2013 | -- | $78,511 | $26,529 | $51,982 |
Source: Public Records
Map
Nearby Homes
- 265 N 4th Ave
- 1290 Baltimore St
- 260 N 13th Ave
- 1380 Detroit St
- 95 S 17th Ave
- 0000 Oregon 204
- TBD Oregon 204
- 953 N 15th Ave
- 900 N 15th Ave
- 902 N 15th Ave
- 1951 Alder St
- 155 S 20th Ave
- 68881 Indian Creek Rd
- 71564 Palmer Junction Rd
- 71459 Valley View Rd
- 76014 Oregon 82
- 0 Hindman Rd Unit 175201047
- 73210 Kingsbury Ln
- 0 Palmer Junction Rd
- Ranch
Your Personal Tour Guide
Ask me questions while you tour the home.