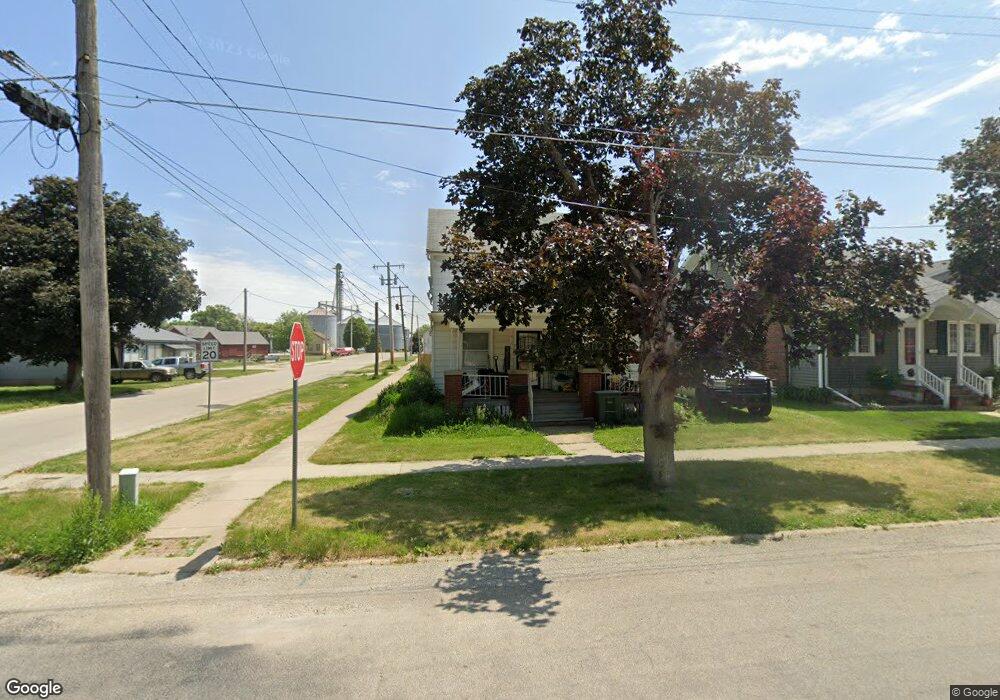
210 N East St Cambridge, IL 61238
Estimated Value: $75,000 - $161,000
4
Beds
2
Baths
516
Sq Ft
$226/Sq Ft
Est. Value
About This Home
This home is located at 210 N East St, Cambridge, IL 61238 and is currently estimated at $116,487, approximately $225 per square foot. 210 N East St is a home located in Henry County with nearby schools including Cambridge Community Grade School and Cambridge Junior/Senior High School.
Ownership History
Date
Name
Owned For
Owner Type
Purchase Details
Closed on
Mar 18, 2013
Sold by
Hulin Donald G and Hagg Wayne R
Bought by
Anderson Ricky and Anderson Amanda
Current Estimated Value
Home Financials for this Owner
Home Financials are based on the most recent Mortgage that was taken out on this home.
Original Mortgage
$57,000
Outstanding Balance
$40,604
Interest Rate
3.75%
Mortgage Type
New Conventional
Estimated Equity
$75,883
Purchase Details
Closed on
Oct 2, 2010
Sold by
Hulin Donald G and Hulin Elvira N
Bought by
Hulin Donald G and Hagg Claire R
Create a Home Valuation Report for This Property
The Home Valuation Report is an in-depth analysis detailing your home's value as well as a comparison with similar homes in the area
Home Values in the Area
Average Home Value in this Area
Purchase History
| Date | Buyer | Sale Price | Title Company |
|---|---|---|---|
| Anderson Ricky | $60,000 | None Available | |
| Hulin Donald G | -- | None Available |
Source: Public Records
Mortgage History
| Date | Status | Borrower | Loan Amount |
|---|---|---|---|
| Open | Anderson Ricky | $57,000 |
Source: Public Records
Tax History Compared to Growth
Tax History
| Year | Tax Paid | Tax Assessment Tax Assessment Total Assessment is a certain percentage of the fair market value that is determined by local assessors to be the total taxable value of land and additions on the property. | Land | Improvement |
|---|---|---|---|---|
| 2024 | $1,368 | $21,431 | $2,363 | $19,068 |
| 2023 | $1,336 | $21,114 | $2,328 | $18,786 |
| 2022 | $1,230 | $19,442 | $2,144 | $17,298 |
| 2021 | $1,084 | $18,002 | $1,985 | $16,017 |
| 2020 | $1,056 | $17,518 | $1,932 | $15,586 |
| 2019 | $1,038 | $17,257 | $1,903 | $15,354 |
| 2018 | $995 | $16,755 | $1,848 | $14,907 |
| 2017 | $973 | $16,314 | $1,799 | $14,515 |
| 2016 | $970 | $16,233 | $1,790 | $14,443 |
| 2015 | $2,174 | $16,233 | $1,790 | $14,443 |
| 2013 | $2,174 | $23,941 | $1,808 | $22,133 |
Source: Public Records
Map
Nearby Homes