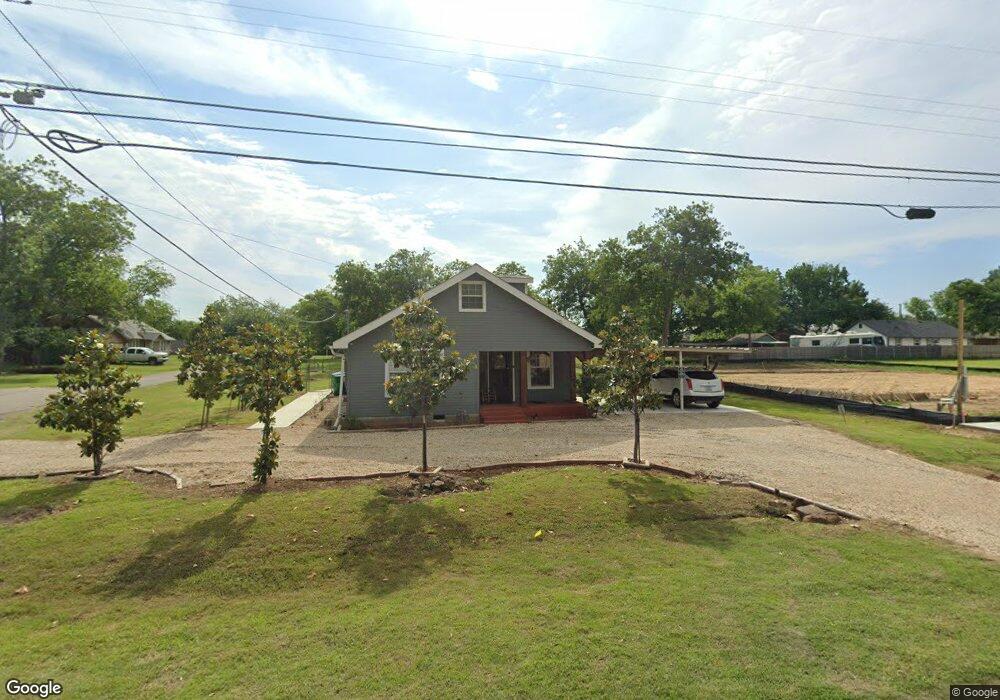
210 N Main St Joshua, TX 76058
Estimated Value: $173,736 - $425,000
2
Beds
1
Bath
9,999
Sq Ft
$24/Sq Ft
Est. Value
About This Home
This home is located at 210 N Main St, Joshua, TX 76058 and is currently estimated at $243,434, approximately $24 per square foot. 210 N Main St is a home located in Johnson County with nearby schools including H.D. Staples Elementary School, R C Loflin Middle School, and Joshua High School.
Ownership History
Date
Name
Owned For
Owner Type
Purchase Details
Closed on
Jul 17, 2008
Sold by
Smith Doris
Bought by
Mondragon Oscar J
Current Estimated Value
Home Financials for this Owner
Home Financials are based on the most recent Mortgage that was taken out on this home.
Original Mortgage
$67,467
Outstanding Balance
$43,569
Interest Rate
6.09%
Mortgage Type
Purchase Money Mortgage
Estimated Equity
$199,865
Create a Home Valuation Report for This Property
The Home Valuation Report is an in-depth analysis detailing your home's value as well as a comparison with similar homes in the area
Home Values in the Area
Average Home Value in this Area
Purchase History
| Date | Buyer | Sale Price | Title Company |
|---|---|---|---|
| Mondragon Oscar J | -- | Fatco |
Source: Public Records
Mortgage History
| Date | Status | Borrower | Loan Amount |
|---|---|---|---|
| Open | Mondragon Oscar J | $67,467 |
Source: Public Records
Tax History Compared to Growth
Tax History
| Year | Tax Paid | Tax Assessment Tax Assessment Total Assessment is a certain percentage of the fair market value that is determined by local assessors to be the total taxable value of land and additions on the property. | Land | Improvement |
|---|---|---|---|---|
| 2025 | $1,301 | $141,718 | $45,000 | $96,718 |
| 2024 | $2,661 | $109,343 | $0 | $0 |
| 2023 | $1,041 | $141,718 | $45,000 | $96,718 |
| 2022 | $2,267 | $110,644 | $35,000 | $75,644 |
| 2021 | $2,080 | $110,644 | $35,000 | $75,644 |
| 2020 | $2,045 | $110,644 | $35,000 | $75,644 |
| 2019 | $1,953 | $67,894 | $20,000 | $47,894 |
| 2018 | $1,889 | $63,894 | $16,000 | $47,894 |
| 2017 | $1,888 | $63,894 | $16,000 | $47,894 |
| 2016 | $1,888 | $63,894 | $16,000 | $47,894 |
| 2015 | $1,483 | $63,894 | $16,000 | $47,894 |
| 2014 | $1,483 | $63,894 | $16,000 | $47,894 |
Source: Public Records
Map
Nearby Homes