Estimated Value: $234,000 - $279,000
3
Beds
2
Baths
1,911
Sq Ft
$135/Sq Ft
Est. Value
About This Home
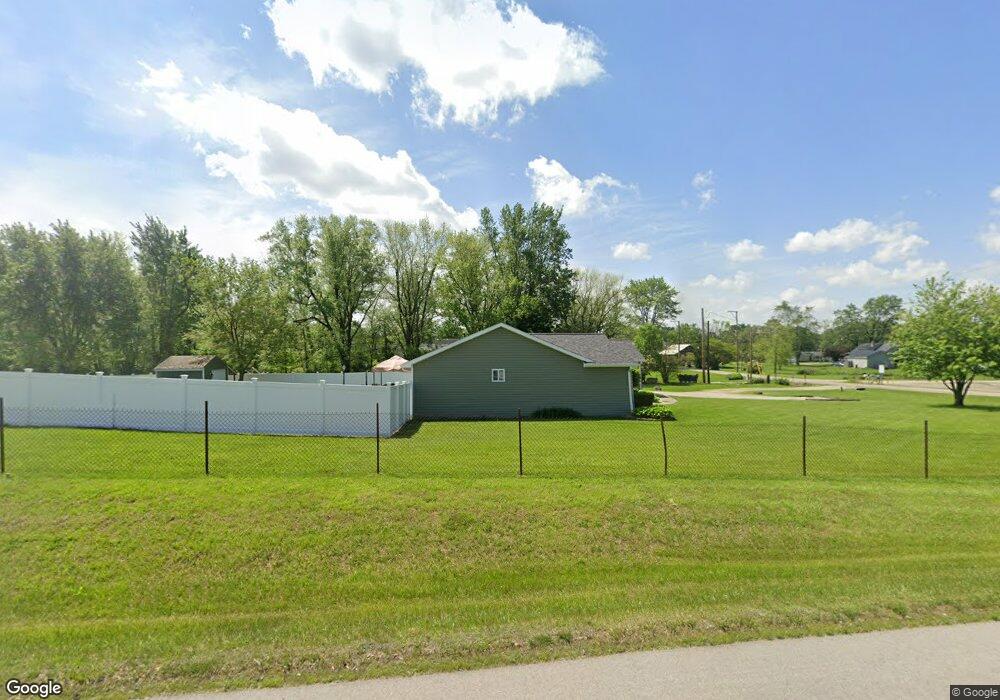
This home is located at 210 N Pittenger Rd, Selma, IN 47383 and is currently estimated at $257,583, approximately $134 per square foot. 210 N Pittenger Rd is a home located in Delaware County with nearby schools including Selma Elementary School, Selma Middle School, and Wapahani High School.
Ownership History
Date
Name
Owned For
Owner Type
Purchase Details
Closed on
Mar 25, 2011
Sold by
Homesales Inc
Bought by
Green Robert M
Current Estimated Value
Home Financials for this Owner
Home Financials are based on the most recent Mortgage that was taken out on this home.
Original Mortgage
$100,747
Outstanding Balance
$70,289
Interest Rate
5.12%
Mortgage Type
FHA
Estimated Equity
$187,294
Purchase Details
Closed on
Feb 23, 2011
Sold by
Chase Home Finance Llc
Bought by
Homesales Inc
Home Financials for this Owner
Home Financials are based on the most recent Mortgage that was taken out on this home.
Original Mortgage
$100,747
Outstanding Balance
$70,289
Interest Rate
5.12%
Mortgage Type
FHA
Estimated Equity
$187,294
Purchase Details
Closed on
Dec 9, 2010
Sold by
Fender Geneva R
Bought by
Chase Home Finance Llc
Create a Home Valuation Report for This Property
The Home Valuation Report is an in-depth analysis detailing your home's value as well as a comparison with similar homes in the area
Home Values in the Area
Average Home Value in this Area
Purchase History
| Date | Buyer | Sale Price | Title Company |
|---|---|---|---|
| Green Robert M | -- | Chicago Title Insurance Co | |
| Homesales Inc | -- | None Available | |
| Chase Home Finance Llc | -- | None Available |
Source: Public Records
Mortgage History
| Date | Status | Borrower | Loan Amount |
|---|---|---|---|
| Open | Green Robert M | $100,747 |
Source: Public Records
Tax History Compared to Growth
Tax History
| Year | Tax Paid | Tax Assessment Tax Assessment Total Assessment is a certain percentage of the fair market value that is determined by local assessors to be the total taxable value of land and additions on the property. | Land | Improvement |
|---|---|---|---|---|
| 2024 | $1,412 | $183,900 | $29,100 | $154,800 |
| 2023 | $1,411 | $188,000 | $29,100 | $158,900 |
| 2022 | $1,535 | $189,800 | $29,100 | $160,700 |
| 2021 | $1,408 | $171,100 | $24,400 | $146,700 |
| 2020 | $1,445 | $171,100 | $24,400 | $146,700 |
| 2019 | $1,186 | $157,100 | $23,300 | $133,800 |
| 2018 | $1,178 | $160,400 | $23,300 | $137,100 |
| 2017 | $1,192 | $165,500 | $23,300 | $142,200 |
| 2016 | $1,208 | $167,200 | $23,300 | $143,900 |
| 2014 | $1,122 | $167,600 | $23,300 | $144,300 |
| 2013 | -- | $167,700 | $23,300 | $144,400 |
Source: Public Records
Map
Nearby Homes
- 314 S Union St
- 9105 E Jackson St
- 9204 E Miller St S
- 804 S Albany St
- 905 S County Road 550 E
- 1301 N County Road 650 E
- 304 N County Road 500 E
- 901 S Lancaster Rd
- 204 N Cook Rd
- 825 N County Road 800 E
- 401 N Gray St
- 4001 S Whitney Rd
- 0 E Fairway Dr
- 811 W Jackson St
- 2300 N Country Club Rd
- 1519 E Centennial Ave
- 7201 E Windsor Rd
- 146 W Washington St
- 310 N Division St
- 616 N Edgewood Dr
- 209 N Pittenger Rd
- 0 E Sunset Dr
- 0 E Sunset Dr Unit 201638182
- 0 E Sunset Dr Unit LOT 11 20000947
- 9700 E Jackson St
- 9704 E Jackson St
- 9708 E Jackson St
- 9800 E Jackson St
- 9616 E Jackson St
- 9804 E Jackson St
- 207 N Pittenger Rd
- 9604 E Jackson St
- 205 N Pittenger Rd
- 9812 E Jackson St
- 0 N Co Road 600 E
- 9600 E Jackson St
- 9900 E Jackson St
- 9615 E Jackson St
- 9512 E Jackson St
- 9516 9518 E Jackson St