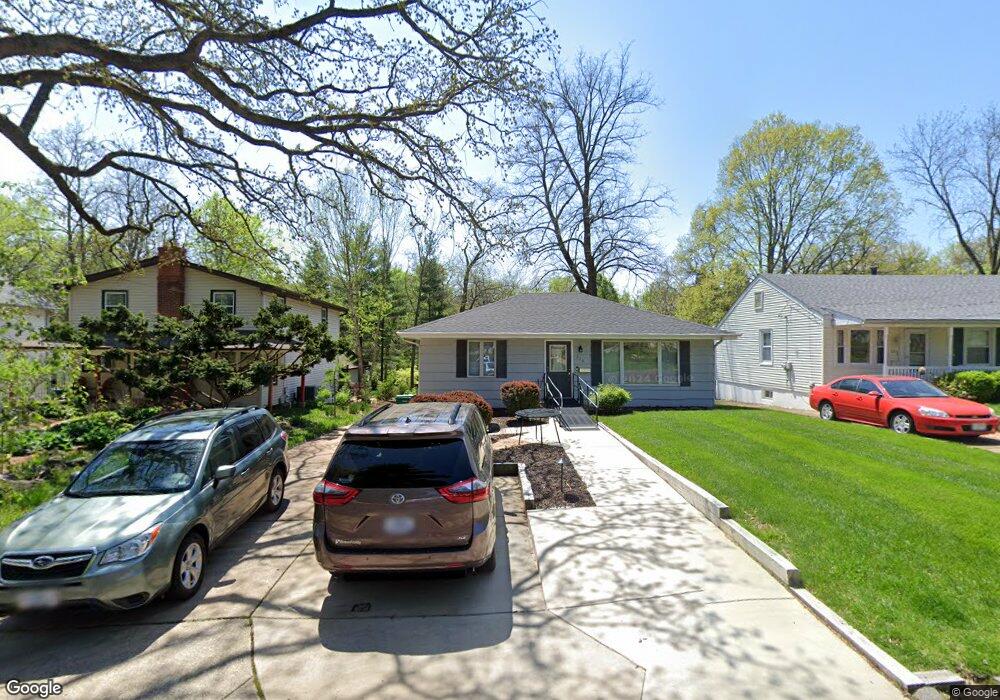
210 Oak Tree Dr Saint Louis, MO 63119
Estimated Value: $302,803 - $327,000
2
Beds
3
Baths
1,172
Sq Ft
$266/Sq Ft
Est. Value
About This Home
This home is located at 210 Oak Tree Dr, Saint Louis, MO 63119 and is currently estimated at $311,451, approximately $265 per square foot. 210 Oak Tree Dr is a home located in St. Louis County with nearby schools including Edgar Road Elementary School, Hixson Middle School, and Webster Groves High School.
Ownership History
Date
Name
Owned For
Owner Type
Purchase Details
Closed on
Mar 29, 2000
Sold by
Christenart Inc
Bought by
Severson Carolyn Jean and Southall Edward C
Current Estimated Value
Home Financials for this Owner
Home Financials are based on the most recent Mortgage that was taken out on this home.
Original Mortgage
$82,235
Outstanding Balance
$27,602
Interest Rate
8.37%
Estimated Equity
$283,849
Purchase Details
Closed on
Feb 22, 2000
Sold by
United Companies Lending Corp and Preston Linda
Bought by
Cherry David H
Home Financials for this Owner
Home Financials are based on the most recent Mortgage that was taken out on this home.
Original Mortgage
$82,235
Outstanding Balance
$27,602
Interest Rate
8.37%
Estimated Equity
$283,849
Purchase Details
Closed on
Oct 14, 1999
Sold by
Noce Thomas J and Noce Ann Mary
Bought by
Christenart Inc
Home Financials for this Owner
Home Financials are based on the most recent Mortgage that was taken out on this home.
Original Mortgage
$72,000
Interest Rate
7.9%
Create a Home Valuation Report for This Property
The Home Valuation Report is an in-depth analysis detailing your home's value as well as a comparison with similar homes in the area
Home Values in the Area
Average Home Value in this Area
Purchase History
| Date | Buyer | Sale Price | Title Company |
|---|---|---|---|
| Severson Carolyn Jean | $129,000 | -- | |
| Southall Jean Severson | -- | -- | |
| Cherry David H | -- | -- | |
| Christenart Inc | $80,000 | Land Title Company |
Source: Public Records
Mortgage History
| Date | Status | Borrower | Loan Amount |
|---|---|---|---|
| Open | Severson Carolyn Jean | $82,235 | |
| Previous Owner | Christenart Inc | $72,000 |
Source: Public Records
Tax History
| Year | Tax Paid | Tax Assessment Tax Assessment Total Assessment is a certain percentage of the fair market value that is determined by local assessors to be the total taxable value of land and additions on the property. | Land | Improvement |
|---|---|---|---|---|
| 2025 | $3,772 | $59,660 | $31,670 | $27,990 |
| 2024 | $3,772 | $54,100 | $25,330 | $28,770 |
| 2023 | $3,753 | $54,100 | $25,330 | $28,770 |
| 2022 | $3,743 | $50,100 | $22,170 | $27,930 |
| 2021 | $3,731 | $50,100 | $22,170 | $27,930 |
| 2020 | $2,478 | $30,780 | $25,080 | $5,700 |
| 2019 | $2,464 | $30,780 | $25,080 | $5,700 |
| 2018 | $2,480 | $27,520 | $15,830 | $11,690 |
| 2016 | $2,394 | $25,630 | $11,080 | $14,550 |
Source: Public Records
Map
Nearby Homes
- 1116 S Elm Ave
- 1334 Pinetree Ln
- 1412 Wells Ave
- 804 Edgar Rd
- 55 W Drake Ave
- 220 Chestnut Ave
- 539 Colebrook Dr Unit B
- 1218 Culverhill Dr
- 8261 Watson Rd
- 1527 S Rock Hill Rd
- 401 Reavis Place Unit 29
- 1139 Hawken Place Unit 6
- 1187 Hawken Place
- 7910 S Rock Hill Rd
- 324 Stark Ct
- 60 Flamingo Dr
- 618 S Rock Hill Rd
- 7609 General Meade Ln
- 7917 Grantwood Cove Ln
- 426 Pasadena Ave
- 204 Oak Tree Dr
- 214 Oak Tree Dr
- 200 Oak Tree Dr
- 218 Oak Tree Dr
- 1014 Colebrook Dr
- 1020 Colebrook Dr
- 144 Oak Tree Dr
- 209 Oak Tree Dr
- 203 Oak Tree Dr
- 1024 Colebrook Dr
- 217 Oak Tree Dr
- 142 Oak Tree Dr
- 230 Oak Tree Dr
- 143 Saint George Place
- 225 Oak Tree Dr
- 1030 Colebrook Dr
- 961 Colebrook Dr
- 917 Colebrook Dr
- 134 Oak Tree Dr
- 238 Oak Tree Dr
Your Personal Tour Guide
Ask me questions while you tour the home.