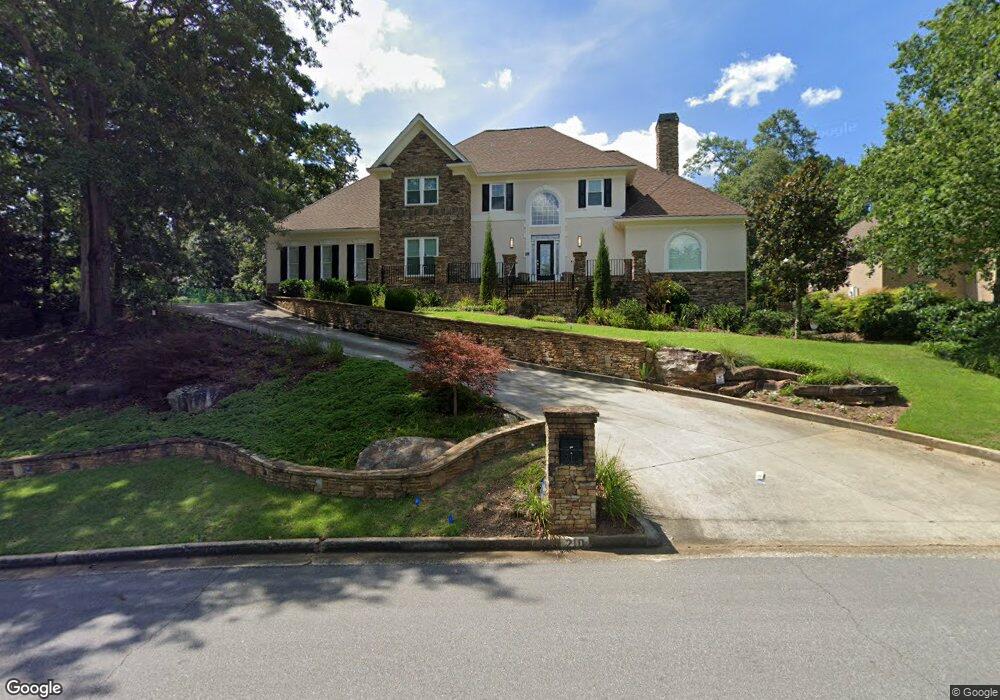
210 Pinnacle Point Duluth, GA 30097
Warsaw NeighborhoodEstimated Value: $1,072,000 - $1,158,000
5
Beds
6
Baths
4,767
Sq Ft
$237/Sq Ft
Est. Value
About This Home
This home is located at 210 Pinnacle Point, Duluth, GA 30097 and is currently estimated at $1,131,820, approximately $237 per square foot. 210 Pinnacle Point is a home located in Fulton County with nearby schools including Medlock Bridge Elementary School, Autrey Mill Middle School, and Johns Creek High School.
Ownership History
Date
Name
Owned For
Owner Type
Purchase Details
Closed on
Dec 8, 2017
Sold by
Zeng Heng
Bought by
Zeng Heng and Zhou Qun
Current Estimated Value
Purchase Details
Closed on
Nov 13, 2016
Sold by
Tnt Property Holdings Llc
Bought by
Smith John R
Purchase Details
Closed on
Dec 28, 2010
Sold by
Smith Tammy
Bought by
Tnt Property Holdings Llc
Purchase Details
Closed on
May 21, 2010
Sold by
Smith John
Bought by
Smith Tammy
Purchase Details
Closed on
Aug 17, 2006
Sold by
Pace Richard and Pace Carol E
Bought by
Smith John and Smith Tammy
Purchase Details
Closed on
Oct 16, 2000
Sold by
Cleveland Jon R
Bought by
Pace Carol E
Home Financials for this Owner
Home Financials are based on the most recent Mortgage that was taken out on this home.
Original Mortgage
$382,500
Interest Rate
7.93%
Mortgage Type
New Conventional
Create a Home Valuation Report for This Property
The Home Valuation Report is an in-depth analysis detailing your home's value as well as a comparison with similar homes in the area
Home Values in the Area
Average Home Value in this Area
Purchase History
| Date | Buyer | Sale Price | Title Company |
|---|---|---|---|
| Zeng Heng | -- | -- | |
| Zeng Heng | $583,000 | -- | |
| Smith John R | $508,900 | -- | |
| Tnt Property Holdings Llc | -- | -- | |
| Smith Tammy | -- | -- | |
| Smith John | $510,000 | -- | |
| Pace Carol E | $425,000 | -- |
Source: Public Records
Mortgage History
| Date | Status | Borrower | Loan Amount |
|---|---|---|---|
| Previous Owner | Pace Carol E | $382,500 |
Source: Public Records
Tax History
| Year | Tax Paid | Tax Assessment Tax Assessment Total Assessment is a certain percentage of the fair market value that is determined by local assessors to be the total taxable value of land and additions on the property. | Land | Improvement |
|---|---|---|---|---|
| 2025 | $11,878 | $386,120 | $156,040 | $230,080 |
| 2023 | $11,170 | $395,720 | $156,040 | $239,680 |
| 2022 | $8,262 | $269,240 | $56,160 | $213,080 |
| 2021 | $8,236 | $261,400 | $54,520 | $206,880 |
| 2020 | $7,351 | $228,360 | $45,720 | $182,640 |
| 2019 | $885 | $224,360 | $44,920 | $179,440 |
| 2018 | $7,135 | $219,080 | $43,840 | $175,240 |
| 2017 | $6,928 | $203,560 | $41,960 | $161,600 |
| 2016 | $6,828 | $203,560 | $41,960 | $161,600 |
| 2015 | $6,904 | $203,560 | $41,960 | $161,600 |
| 2014 | $5,050 | $143,200 | $31,440 | $111,760 |
Source: Public Records
Map
Nearby Homes
- 120 Summerour Vale
- 264 Summerour Vale
- 9240 Prestwick Club Dr
- 5435 Hoylake Ct
- 5425 Hoylake Ct
- 5161 Dinant Dr
- 5360 Northwater Way
- 5435 Chelsen Wood Dr
- 5048 Dinant Dr
- 4457 Ridgegate Dr
- 4456 Ridgegate Dr Unit 3
- 395 Pelton Ct
- 9410 Coleherne Ct Unit 1
- 5005 Johns Creek Ct
- 5185 Buice Rd
- 4611 Medlock Bridge Rd
- 1650 Stethem Ferry
- 250 Parian Run
- 195 High Bluff Ct
- 335 Marshy Pointe
- 210 Pinnacle Pointe
- 220 Pinnacle Pointe Unit 2
- 200 Pinnacle Pointe
- 200 Pinnacle Pte
- 9155 Waits Ferry Crossing Unit 51
- 9155 Waits Ferry Crossing
- 9145 Waits Ferry Crossing
- 215 Pinnacle Pointe
- 230 Pinnacle Pointe
- 130 Whitney Valley Walk
- 110 Summerour Vale
- 122 Summerour Vale
- 102 Summerour Vale
- 270 Summerour Vale
- 268 Summerour Vale
- 104 Summerour Vale
- 266 Summerour Vale Unit 266
- 100 Summerour Vale Unit 100
- 106 Summerour Vale Unit 106
- 9125 Waits Ferry Crossing
Your Personal Tour Guide
Ask me questions while you tour the home.