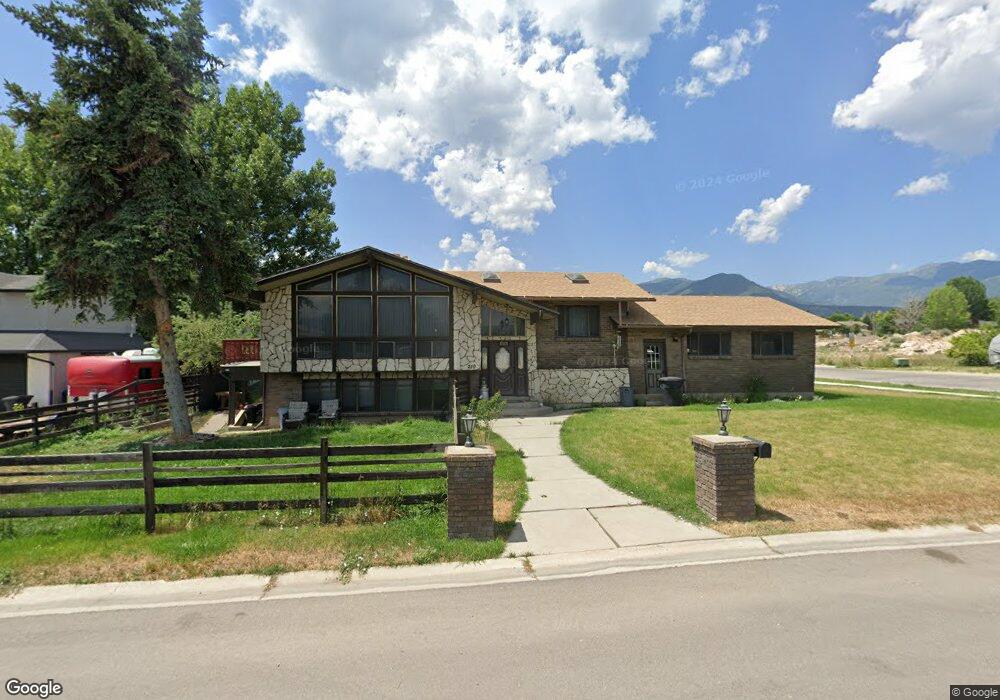
210 S 200 E Midway, UT 84049
Estimated Value: $688,132 - $908,000
4
Beds
3
Baths
3,249
Sq Ft
$246/Sq Ft
Est. Value
About This Home
This home is located at 210 S 200 E, Midway, UT 84049 and is currently estimated at $798,033, approximately $245 per square foot. 210 S 200 E is a home located in Wasatch County with nearby schools including Midway Elementary School, Rocky Mountain Middle School, and Wasatch High School.
Ownership History
Date
Name
Owned For
Owner Type
Purchase Details
Closed on
Nov 6, 2020
Sold by
Rvw Llc
Bought by
Norton Shoni and Naylor Michael
Current Estimated Value
Home Financials for this Owner
Home Financials are based on the most recent Mortgage that was taken out on this home.
Original Mortgage
$413,374
Outstanding Balance
$368,504
Interest Rate
2.9%
Mortgage Type
FHA
Estimated Equity
$429,529
Purchase Details
Closed on
Oct 13, 2017
Sold by
Norton Ray E
Bought by
Rvw Llc
Purchase Details
Closed on
Jul 17, 2013
Sold by
Norton Diana
Bought by
Wells Fargo Bank Na
Purchase Details
Closed on
Sep 26, 2007
Sold by
Norton Diana
Bought by
Norton Ray E
Create a Home Valuation Report for This Property
The Home Valuation Report is an in-depth analysis detailing your home's value as well as a comparison with similar homes in the area
Home Values in the Area
Average Home Value in this Area
Purchase History
| Date | Buyer | Sale Price | Title Company |
|---|---|---|---|
| Norton Shoni | -- | Provo Land Title Co | |
| Rvw Llc | -- | Provo Land Title Co | |
| Wells Fargo Bank Na | $202,500 | None Available | |
| Norton Ray E | -- | None Available |
Source: Public Records
Mortgage History
| Date | Status | Borrower | Loan Amount |
|---|---|---|---|
| Open | Norton Shoni | $413,374 |
Source: Public Records
Tax History
| Year | Tax Paid | Tax Assessment Tax Assessment Total Assessment is a certain percentage of the fair market value that is determined by local assessors to be the total taxable value of land and additions on the property. | Land | Improvement |
|---|---|---|---|---|
| 2025 | $2,989 | $589,800 | $250,000 | $339,800 |
| 2024 | $2,956 | $589,800 | $250,000 | $339,800 |
| 2023 | $2,956 | $677,660 | $200,000 | $477,660 |
| 2022 | $3,737 | $677,660 | $200,000 | $477,660 |
| 2021 | $2,367 | $331,618 | $150,000 | $181,618 |
| 2020 | $2,257 | $306,618 | $125,000 | $181,618 |
| 2019 | $2,064 | $168,640 | $0 | $0 |
| 2018 | $2,064 | $168,640 | $0 | $0 |
| 2017 | $1,925 | $156,373 | $0 | $0 |
| 2016 | $1,696 | $134,373 | $0 | $0 |
| 2015 | $1,612 | $134,373 | $0 | $0 |
| 2014 | $2,237 | $143,970 | $0 | $0 |
Source: Public Records
Map
Nearby Homes