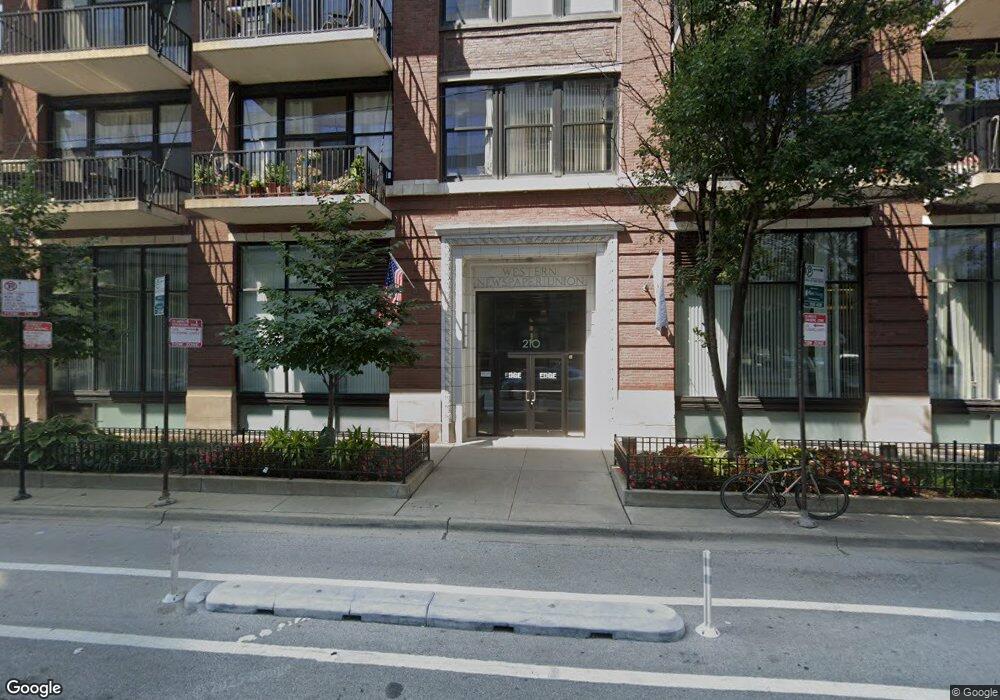
The Edge Lofts and Tower 210 S Desplaines St Unit 511 Chicago, IL 60661
West Loop NeighborhoodEstimated Value: $282,000 - $523,000
Studio
--
Bath
--
Sq Ft
0.77
Acres Lot
About This Home
This home is located at 210 S Desplaines St Unit 511, Chicago, IL 60661 and is currently estimated at $349,135. 210 S Desplaines St Unit 511 is a home located in Cook County with nearby schools including Skinner Elementary School, Wells Community Academy High School, and Chicago International Charter School.
Ownership History
Date
Name
Owned For
Owner Type
Purchase Details
Closed on
Jun 5, 2009
Sold by
Lacorcia John Paul
Bought by
Karampelas Constantine
Current Estimated Value
Home Financials for this Owner
Home Financials are based on the most recent Mortgage that was taken out on this home.
Original Mortgage
$198,750
Outstanding Balance
$125,099
Interest Rate
4.94%
Mortgage Type
Unknown
Estimated Equity
$224,036
Purchase Details
Closed on
Feb 2, 2006
Sold by
Lee Daniel N
Bought by
Lacorcia John Paul
Home Financials for this Owner
Home Financials are based on the most recent Mortgage that was taken out on this home.
Original Mortgage
$212,000
Interest Rate
6.34%
Mortgage Type
Fannie Mae Freddie Mac
Purchase Details
Closed on
Nov 10, 2004
Sold by
Adams Des Plaines Llc
Bought by
Lee Daniel N
Home Financials for this Owner
Home Financials are based on the most recent Mortgage that was taken out on this home.
Original Mortgage
$186,458
Interest Rate
4.5%
Mortgage Type
Unknown
Create a Home Valuation Report for This Property
The Home Valuation Report is an in-depth analysis detailing your home's value as well as a comparison with similar homes in the area
Home Values in the Area
Average Home Value in this Area
Purchase History
We collect this data history from publicly available records. To have your information removed, we recommend requesting removal directly through your county’s website.
| Date | Buyer | Sale Price | Title Company |
|---|---|---|---|
| Karampelas Constantine | $265,000 | Chicago Title Insurance Co | |
| Lacorcia John Paul | $265,000 | Git | |
| Lee Daniel N | $233,500 | Cti |
Source: Public Records
Mortgage History
We collect this data history from publicly available records. To have your information removed, we recommend requesting removal directly through your county’s website.
| Date | Status | Borrower | Loan Amount |
|---|---|---|---|
| Open | Karampelas Constantine | $198,750 | |
| Previous Owner | Lacorcia John Paul | $212,000 | |
| Previous Owner | Lee Daniel N | $186,458 |
Source: Public Records
Tax History
| Year | Tax Paid | Tax Assessment Tax Assessment Total Assessment is a certain percentage of the fair market value that is determined by local assessors to be the total taxable value of land and additions on the property. | Land | Improvement |
|---|---|---|---|---|
| 2025 | $4,848 | $25,154 | $736 | $24,418 |
| 2024 | $4,848 | $25,154 | $736 | $24,418 |
| 2023 | $4,704 | $26,214 | $403 | $25,811 |
| 2022 | $4,704 | $26,214 | $403 | $25,811 |
| 2021 | $4,617 | $26,213 | $403 | $25,810 |
| 2020 | $3,978 | $20,901 | $403 | $20,498 |
| 2019 | $3,920 | $22,875 | $403 | $22,472 |
| 2018 | $4,533 | $22,875 | $403 | $22,472 |
| 2017 | $4,345 | $20,113 | $355 | $19,758 |
| 2016 | $4,028 | $20,113 | $355 | $19,758 |
| 2015 | $3,912 | $21,348 | $355 | $20,993 |
| 2014 | $2,657 | $14,320 | $216 | $14,104 |
| 2013 | $2,604 | $14,320 | $216 | $14,104 |
Source: Public Records
About The Edge Lofts and Tower
Map
Nearby Homes
- 210 S Desplaines St Unit P99
- 210 S Desplaines St Unit 1603
- 210 S Desplaines St Unit 304
- 210 S Desplaines St Unit 807
- 210 S Desplaines St Unit 803
- 210 S Desplaines St Unit P-003
- 210 S Desplaines St Unit 1209
- 210 S Desplaines St Unit 404
- 728 W Jackson Blvd Unit 613
- 728 W Jackson Blvd Unit 703
- 728 W Jackson Blvd Unit 701
- 728 W Jackson Blvd Unit 302
- 625 W Jackson Blvd Unit 212
- 625 W Jackson Blvd Unit 307
- 625 W Jackson Blvd Unit 402
- 565 W Quincy St Unit 1602
- 565 W Quincy St Unit 801
- 565 W Quincy St Unit 704
- 565 W Quincy St Unit 609
- 565 W Quincy St Unit 1512
- 210 S Desplaines St
- 210 S Desplaines St Unit 608
- 210 S Desplaines St Unit P23
- 210 S Desplaines St Unit P22
- 210 S Desplaines St Unit 2107
- 210 S Desplaines St Unit 611
- 210 S Desplaines St Unit 412
- 210 S Desplaines St Unit P231
- 210 S Desplaines St Unit P182
- 210 S Desplaines St Unit 1703
- 210 S Desplaines St Unit P252
- 210 S Desplaines St Unit P278
- 210 S Desplaines St Unit 605
- 210 S Desplaines St Unit 1609
- 210 S Desplaines St Unit P74
- 210 S Desplaines St Unit P233
- 210 S Desplaines St Unit P188
- 210 S Desplaines St Unit 810
- 210 S Desplaines St Unit P131
- 210 S Desplaines St Unit P130
Your Personal Tour Guide
Ask me questions while you tour the home.