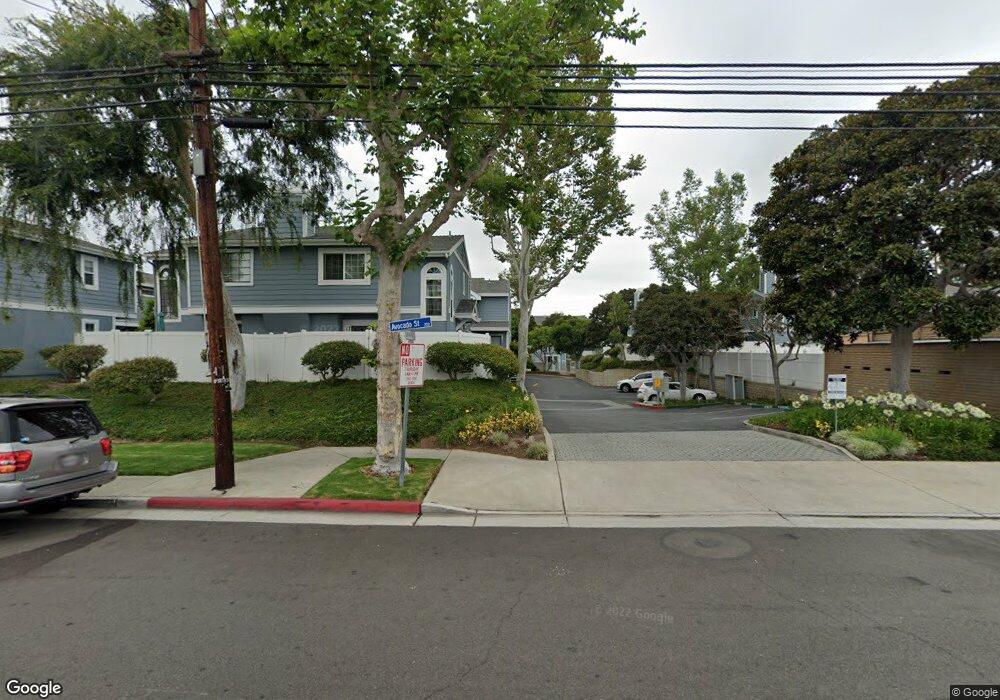
210 Saybrook Ct Costa Mesa, CA 92627
Estimated Value: $833,000 - $991,000
2
Beds
3
Baths
1,368
Sq Ft
$666/Sq Ft
Est. Value
About This Home
This home is located at 210 Saybrook Ct, Costa Mesa, CA 92627 and is currently estimated at $911,260, approximately $666 per square foot. 210 Saybrook Ct is a home located in Orange County with nearby schools including College Park Elementary School, Costa Mesa High School, and Christ Lutheran School.
Ownership History
Date
Name
Owned For
Owner Type
Purchase Details
Closed on
Aug 31, 2000
Sold by
Walter Kierstein and Walter Margie
Bought by
Kierstein Walter and Kierstein Margie Lee
Current Estimated Value
Home Financials for this Owner
Home Financials are based on the most recent Mortgage that was taken out on this home.
Original Mortgage
$203,324
Outstanding Balance
$73,150
Interest Rate
8.11%
Mortgage Type
FHA
Estimated Equity
$838,110
Purchase Details
Closed on
Aug 10, 2000
Sold by
Walter Kierstein and Walter Margie
Bought by
Sullivan Laura
Home Financials for this Owner
Home Financials are based on the most recent Mortgage that was taken out on this home.
Original Mortgage
$203,324
Outstanding Balance
$73,150
Interest Rate
8.11%
Mortgage Type
FHA
Estimated Equity
$838,110
Create a Home Valuation Report for This Property
The Home Valuation Report is an in-depth analysis detailing your home's value as well as a comparison with similar homes in the area
Home Values in the Area
Average Home Value in this Area
Purchase History
| Date | Buyer | Sale Price | Title Company |
|---|---|---|---|
| Kierstein Walter | -- | Chicago Title Co | |
| Spellman Eric Lee | -- | Chicago Title Co | |
| Sullivan Laura | $205,000 | Chicago Title Co |
Source: Public Records
Mortgage History
| Date | Status | Borrower | Loan Amount |
|---|---|---|---|
| Open | Sullivan Laura | $203,324 |
Source: Public Records
Tax History Compared to Growth
Tax History
| Year | Tax Paid | Tax Assessment Tax Assessment Total Assessment is a certain percentage of the fair market value that is determined by local assessors to be the total taxable value of land and additions on the property. | Land | Improvement |
|---|---|---|---|---|
| 2025 | $3,870 | $308,892 | $148,096 | $160,796 |
| 2024 | $3,870 | $302,836 | $145,192 | $157,644 |
| 2023 | $3,743 | $296,899 | $142,346 | $154,553 |
| 2022 | $3,581 | $291,078 | $139,555 | $151,523 |
| 2021 | $3,459 | $285,371 | $136,819 | $148,552 |
| 2020 | $3,426 | $282,445 | $135,416 | $147,029 |
| 2019 | $3,364 | $276,907 | $132,760 | $144,147 |
| 2018 | $3,301 | $271,478 | $130,157 | $141,321 |
| 2017 | $3,246 | $266,155 | $127,605 | $138,550 |
| 2016 | $3,177 | $260,937 | $125,103 | $135,834 |
| 2015 | $3,144 | $257,018 | $123,224 | $133,794 |
| 2014 | $3,071 | $251,984 | $120,810 | $131,174 |
Source: Public Records
Map
Nearby Homes
- 2273 Columbia Dr
- 2214 Rutgers Dr
- 327 W Wilson St Unit 86
- 327 W Wilson St Unit 49
- 117 E Wilson St Unit C
- 2334 Richmond Way
- 2336 Elden Ave Unit A
- 2214 Elden Ave
- 2330 Vanguard Way Unit F102
- 2330 Vanguard Way Unit L101
- 208 Dartmouth Place
- 2323 Cornell Dr
- 157 Yorktown Ln
- 380 W Wilson St Unit C104
- 2173 Harmony Way
- 2383 Orange Ave
- 404 Brighton Springs
- 117 Clearbrook Ln
- 2459 Elden Ave
- 101 Clearbrook Ln
- 212 Saybrook Ct
- 2215 Saybrook Ln
- 2217 Saybrook Ln
- 214 Saybrook Ct
- 211 Saybrook Ct
- 213 Saybrook Ct
- 2217 Mayfair Ct
- 2219 Saybrook Ln
- 216 Saybrook Ct
- 2219 Mayfair Ct
- 217 Saybrook Ct
- 2221 Saybrook Ln
- 215 Saybrook Ct
- 2224 Saybrook Ln
- 2221 Mayfair Ct
- 2223 Saybrook Ln
- 2214 Mayfair Ct
- 2226 Saybrook Ln
- 2225 Saybrook Ln
- 224 Avocado St