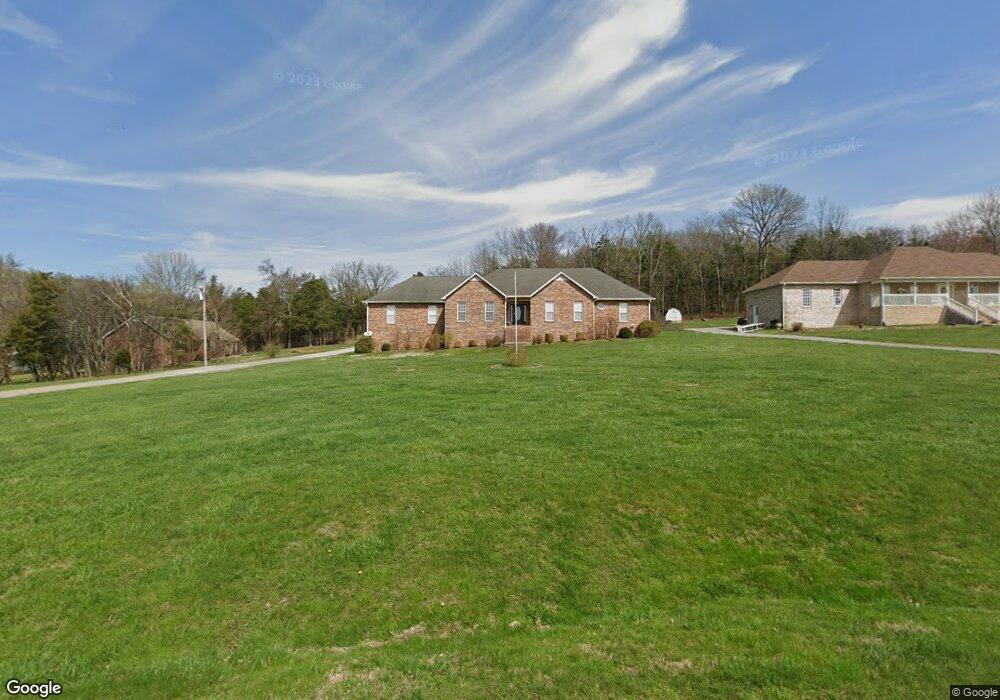
210 Skyview Rd Bell Buckle, TN 37020
Estimated Value: $399,000 - $669,000
--
Bed
3
Baths
2,164
Sq Ft
$229/Sq Ft
Est. Value
About This Home
This home is located at 210 Skyview Rd, Bell Buckle, TN 37020 and is currently estimated at $496,054, approximately $229 per square foot. 210 Skyview Rd is a home located in Bedford County with nearby schools including Cascade Elementary School, Cascade Middle School, and Cascade High School.
Ownership History
Date
Name
Owned For
Owner Type
Purchase Details
Closed on
Oct 7, 2011
Sold by
Parker Kenneth D
Bought by
Housch Kenneth and Housch Stephanie
Current Estimated Value
Home Financials for this Owner
Home Financials are based on the most recent Mortgage that was taken out on this home.
Original Mortgage
$191,500
Outstanding Balance
$131,239
Interest Rate
4.2%
Mortgage Type
Commercial
Estimated Equity
$364,815
Purchase Details
Closed on
Jun 3, 2008
Sold by
Secretary Of Housing And U
Bought by
Parker Kenneth D
Purchase Details
Closed on
Oct 22, 2007
Sold by
Shapiro Kirsch Llp
Bought by
Secretary Of Housing And Urban
Purchase Details
Closed on
Apr 18, 2002
Sold by
Jones Orion
Bought by
Labo Mccroskey Douglas E and Labo Mccroskey
Home Financials for this Owner
Home Financials are based on the most recent Mortgage that was taken out on this home.
Original Mortgage
$146,501
Interest Rate
7.16%
Create a Home Valuation Report for This Property
The Home Valuation Report is an in-depth analysis detailing your home's value as well as a comparison with similar homes in the area
Home Values in the Area
Average Home Value in this Area
Purchase History
| Date | Buyer | Sale Price | Title Company |
|---|---|---|---|
| Housch Kenneth | $198,500 | -- | |
| Parker Kenneth D | $144,000 | -- | |
| Secretary Of Housing And Urban | $145,546 | -- | |
| Labo Mccroskey Douglas E | $156,000 | -- |
Source: Public Records
Mortgage History
| Date | Status | Borrower | Loan Amount |
|---|---|---|---|
| Open | Housch Kenneth | $191,500 | |
| Previous Owner | Labo Mccroskey Douglas E | $146,501 |
Source: Public Records
Tax History Compared to Growth
Tax History
| Year | Tax Paid | Tax Assessment Tax Assessment Total Assessment is a certain percentage of the fair market value that is determined by local assessors to be the total taxable value of land and additions on the property. | Land | Improvement |
|---|---|---|---|---|
| 2024 | $1,659 | $71,350 | $8,500 | $62,850 |
| 2023 | $1,659 | $71,350 | $8,500 | $62,850 |
| 2022 | $1,659 | $71,350 | $8,500 | $62,850 |
| 2021 | $1,402 | $71,350 | $8,500 | $62,850 |
| 2020 | $1,412 | $71,350 | $8,500 | $62,850 |
| 2019 | $1,412 | $53,075 | $6,250 | $46,825 |
| 2018 | $1,359 | $53,075 | $6,250 | $46,825 |
| 2017 | $1,359 | $53,075 | $6,250 | $46,825 |
| 2016 | $1,337 | $53,075 | $6,250 | $46,825 |
| 2015 | $1,337 | $53,075 | $6,250 | $46,825 |
| 2014 | $1,061 | $46,719 | $0 | $0 |
Source: Public Records
Map
Nearby Homes
- 286 Emily Ln
- 0 Happy Valley Rd
- 199 Gilmore Ln
- 0 Johnson Place Unit RTC2990038
- 0 Johnson Place Unit RTC2990036
- 0 Johnson Ln
- 305 Liberty Pike
- 201 Cumberland St
- 10B Puncheon Camp Ln
- 10A Puncheon Camp Ln
- 2640 Highway 82 E
- 101 Webb Rd E
- 0 Webb Rd
- 289 5th St
- 405 Webb Rd W
- 109 Autumn Ln
- 345 Dye Rd
- 264 Puncheon Camp Rd
- 0 Millersburg Rd
- 108 Nestledown Crossing