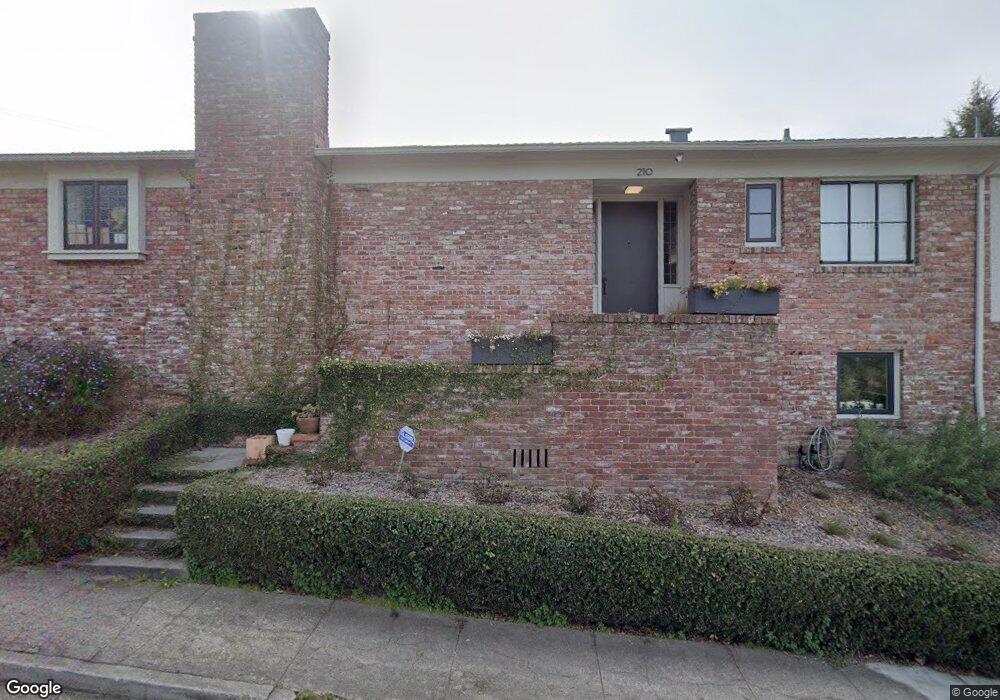
210 The Uplands Berkeley, CA 94705
Claremont NeighborhoodEstimated Value: $2,370,000 - $2,668,000
3
Beds
3
Baths
1,935
Sq Ft
$1,293/Sq Ft
Est. Value
About This Home
This home is located at 210 The Uplands, Berkeley, CA 94705 and is currently estimated at $2,501,382, approximately $1,292 per square foot. 210 The Uplands is a home located in Alameda County with nearby schools including John Muir Elementary School, Emerson Elementary School, and Malcolm X Elementary School.
Ownership History
Date
Name
Owned For
Owner Type
Purchase Details
Closed on
Nov 1, 2023
Sold by
Downs Juniper L
Bought by
Jld Living Trust and Downs
Current Estimated Value
Purchase Details
Closed on
Oct 23, 2021
Sold by
Downs Michael J
Bought by
Downs Juniper
Purchase Details
Closed on
Jul 19, 2019
Sold by
Suileabhain Keith and Suileabhain Keith Tighearnach
Bought by
Downs Juniper Lesnik and Downs Michael J
Home Financials for this Owner
Home Financials are based on the most recent Mortgage that was taken out on this home.
Original Mortgage
$1,522,500
Interest Rate
3.82%
Mortgage Type
New Conventional
Purchase Details
Closed on
Aug 15, 2015
Sold by
Moore James M and Oral L Moore 1987 Trust
Bought by
Moore Jean P and Jean P Moore 1985 Trust
Create a Home Valuation Report for This Property
The Home Valuation Report is an in-depth analysis detailing your home's value as well as a comparison with similar homes in the area
Home Values in the Area
Average Home Value in this Area
Purchase History
| Date | Buyer | Sale Price | Title Company |
|---|---|---|---|
| Jld Living Trust | -- | None Listed On Document | |
| Downs Juniper | -- | None Available | |
| Downs Juniper Lesnik | $2,030,000 | Old Republic Title Company | |
| Moore Jean P | -- | None Available |
Source: Public Records
Mortgage History
| Date | Status | Borrower | Loan Amount |
|---|---|---|---|
| Previous Owner | Downs Juniper Lesnik | $1,522,500 |
Source: Public Records
Tax History
| Year | Tax Paid | Tax Assessment Tax Assessment Total Assessment is a certain percentage of the fair market value that is determined by local assessors to be the total taxable value of land and additions on the property. | Land | Improvement |
|---|---|---|---|---|
| 2025 | $31,067 | $2,213,068 | $874,904 | $1,345,164 |
| 2024 | $31,067 | $2,169,545 | $857,752 | $1,318,793 |
| 2023 | $30,393 | $2,133,875 | $840,936 | $1,292,939 |
| 2022 | $29,872 | $2,085,036 | $824,448 | $1,267,588 |
| 2021 | $30,089 | $2,051,030 | $808,288 | $1,242,742 |
| 2020 | $28,700 | $2,030,000 | $800,000 | $1,230,000 |
| 2019 | $8,967 | $450,310 | $308,416 | $141,894 |
| 2018 | $8,766 | $441,482 | $302,370 | $139,112 |
| 2017 | $8,438 | $432,827 | $296,442 | $136,385 |
| 2016 | $8,054 | $424,341 | $290,630 | $133,711 |
| 2015 | $7,921 | $417,968 | $286,265 | $131,703 |
| 2014 | $7,763 | $409,782 | $280,659 | $129,123 |
Source: Public Records
Map
Nearby Homes
- 204 El Camino Real
- 0 Tunnel Rd
- 45 Vicente Rd
- 1488 Alvarado Rd
- 5668 Buena Vista Ave
- 641 Alvarado Rd
- 260 Alvarado Rd
- 6189 Margarido Dr
- 150 Vicente Rd
- 0 Gravatt Dr Unit 41122154
- 2 Gravatt Dr
- 142 Gravatt Dr
- 5416 Golden Gate Ave
- 5936 Broadway
- 1426 Grand View Dr
- 287 Cross Rd
- 29 Live Oak Rd
- 5941 Keith Ave
- 190 Stonewall Rd
- 2962 Piedmont Ave
- 206 The Uplands
- 211 The Uplands
- 206 El Camino Real
- 205 The Uplands
- 151 El Camino Real
- 220 The Uplands
- 200 The Uplands
- 201 The Uplands
- 118 El Camino Real
- 210 El Camino Real
- 221 The Uplands
- 157 El Camino Real
- 199 The Uplands
- 114 El Camino Real
- 159 El Camino Real
- 190 The Uplands
- 195 The Uplands
- 223 The Uplands
- 110 El Camino Real
- 220 El Camino Real
Your Personal Tour Guide
Ask me questions while you tour the home.